


Multi-wavelength measurements from telescopes worldwide capture the eruption of storms in Jupiter's northern and southern equatorial belts.
Astronomers using the Subaru Telescope contributed to coordinated observations of the planet in January 2017, joining observers using the Atacama Large Millimeter/Submillimeter Array (ALMA), the Very Large Array (VLA), NASA's Hubble Space Telescope (HST), the Gemini North Telescope, the Very Large Telescope (VLT), and the W. M. Keck Telescope in tracking the effects of these storms - visible as bright plumes above the planet's main ammonia ice cloud deck over which they appear. The rising plumes then interacted with Jupiter's powerful winds, which stretched the clouds far from their points of origin.

Figure 1: Subaru/COMICS map of Jupiter at 8.70 microns. Images recorded over the four consecutive nights (January 11-14, 2017) were stitched together to produce an image over 360 degrees in longitude. Several features are indicated on the map (Great Red Spot (GRS), Oval BA (BA), Source SEB Outbreak by arrow #1, Vortices by arrow #3, Hot Spots by arrow #4, and Large Plumes by arrow #5). (Credit: Imke de Pater et al.)
These multi-wavelength, coordinated observations are consistent with one theory, known as moist convection, about how these plumes form. According to this theory, upwelling winds carry a mix of ammonia and water vapor high enough for the water to condense into liquid droplets. The condensing water releases heat that expands the cloud and buoys it quickly upward through other cloud layers, ultimately breaking through the ammonia ice clouds at the top of the atmosphere.
"Mid-infrared images of Jupiter from the Subaru Telescope and the Very Large Telescope and ALMA radio observations indicate the plumes are dark at wavelengths where ammonia gas absorbs", said Glenn Orton of Caltech's Jet Propulsion Laboratory in the United States. "This demonstrates the plumes are rich in ammonia gas, which supports the theory they are driven by moist convection." Yasumasa Kasaba of Tohoku University in Japan added "this is a great example of using coordinated observations over several wavelength regimes to improve the understanding of atmospheric phenomena on other planets".
The observations will ultimately help planetary scientists understand the complex atmospheric dynamics on Jupiter, which, with its Great Red Spot and colorful bands, make it one of the most beautiful and changeable of the giant gas planets in the solar system.
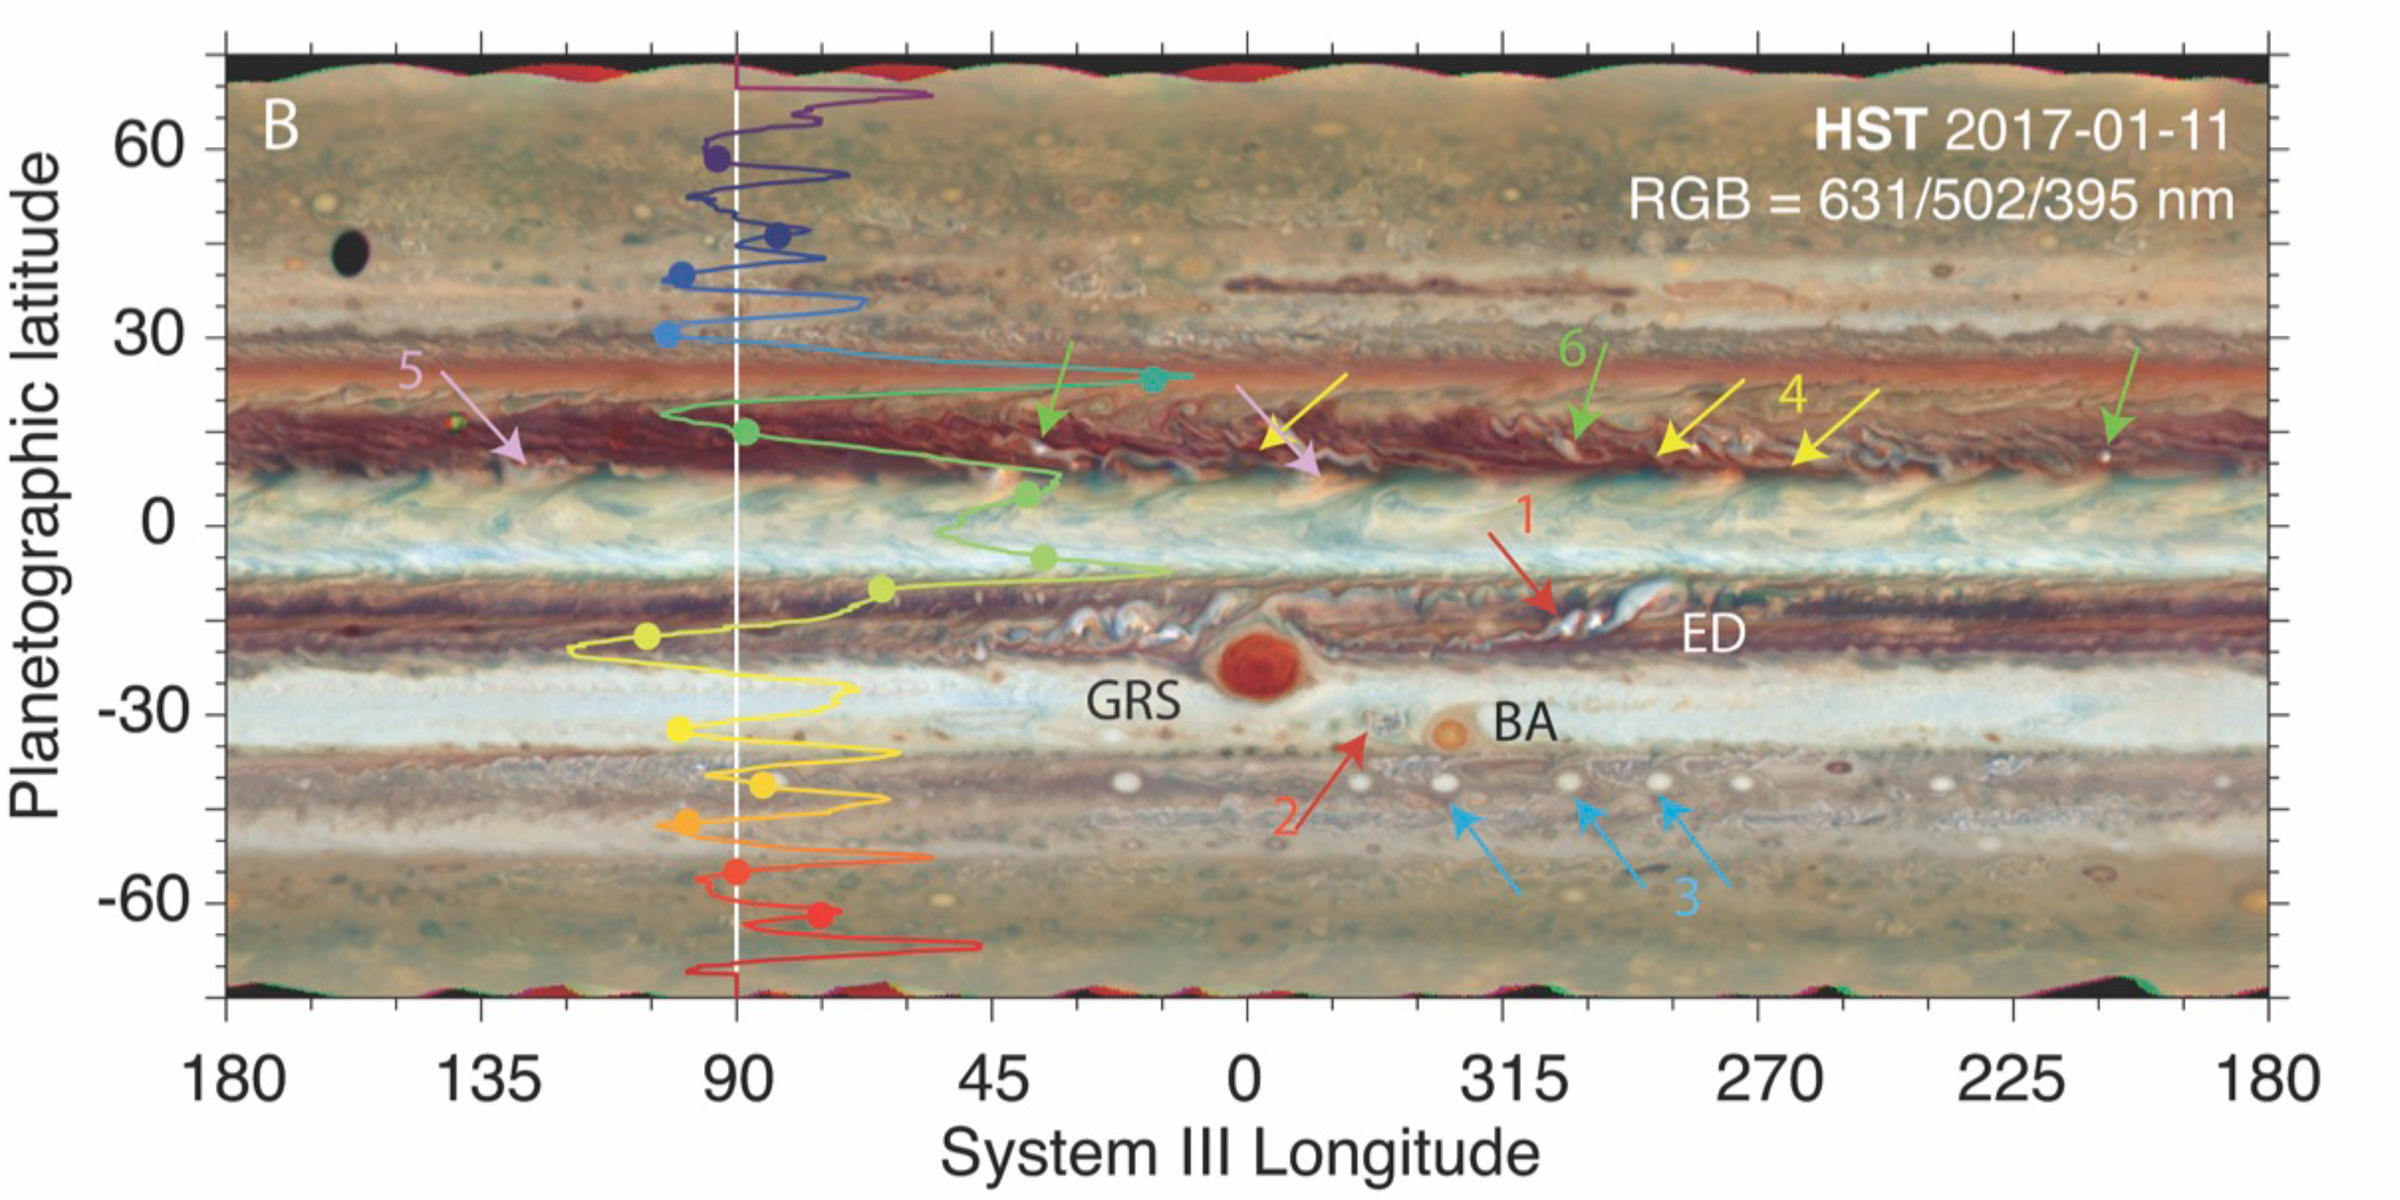
Figure 2: HST map at optical wavelengths from 11 January, 2017, with the zonal wind profile superimposed. (Credit: Imke de Pater et al.)
These results are described in a paper led by Dr. Imke de Pater of UC Berkeley that will be published by the Astronomical Journal online. Glenn Orton, James Sinclair of Caltech's Jet Propulsion Laboratory and Yasumasa Kasaba of Tohoku University in Japan contributed the Subaru mid-infrared images using the COMICS instrument. Among the other co-authors of the paper are graduate students Chris Moeckel and Charles Goullaud and research astronomers Michael Wong and David DeBoer, of UC Berkeley; Robert Sault of the University of Melbourne in Australia; and Bryan Butler of the National Radio Astronomy Observatory. Each was involved in obtaining and analyzing the Hubble, Gemini, ALMA and VLA data, respectively. Leigh Fletcher and Padraig Donnelly of the University of Leicester in the United Kingdom supplied the VLT data. Gordon Bjoraker of the NASA Goddard Space Flight Center in Maryland and Máté Ádámkovics of Clemson University in South Carolina were responsible for the Keck data.
A part of the Subaru Telescope observations presented in the paper were observed through the Keck-Subaru exchange program.