Current status of PFS
Contents
Important notice (2025/12/15)
Replacement of the detector of the SM2 near-infrared camera and suspension of its operation in the S26A Semester
To address the confirmed persistence effect with the Near-Infrared camera of Spectrograph Module 2 (N2 camera), the observatory will replace the detector during semester S26A. Consequently, the N2 camera will be unavailable throughout the S26A semester. Note that PFS operations will continue using the remaining cameras. Please refer below for details.
1. Background
It has been known that the NIR detectors used for PFS (Teledyne H4RG-15) exhibit persistence features. In particular, the persistence of the detector of the N2 camera is a significant problem for our scientific goals. The persistence intensity of the camera stays at ~2% level even several hours after the latest exposure. It is three times higher than that of the other NIR cameras and has the strongest and longest-lasting effect.
Developments continue to enable the data reduction pipeline to model and remove the persistence signals reflecting complex histories of soak (i.e., detector exposures to light) and decay (decreasing intensities of persistence signals with time). Nevertheless, it was concluded that, for the N2 camera with the most severe persistence, the replacement of the detector with the spare showing significantly weaker persistence features was necessary to achieve the required quality of scientific products.
In accordance with the decision by the Subaru Science Advisory Committee (SAC) after careful discussions of the impacts and risks to scientific results with the Steering Committee of the PFS international collaboration, Subaru Telescope will replace the detector of the N2 camera during the S26A semester.
We apologize for any inconvenience and appreciate your understanding and cooperation.
2. Technical details about the persistence
High intensity and slow decay
Technical evaluations of the acquired data revealed that the persistence signals in the N2 camera are significantly stronger immediately after exposures, and also have a much slower decay rate than the other cameras.
Reciprocal impact on calibration and science data
Persistence features affect data reliability in two critical ways:
-
Effects from science exposures to calibration data: Calibration data taken in the morning (after science observations) are affected by the residual flux of science targets as well as OH sky emissions observed during the nights. Figure 1 shows the situation.
-
Effects of calibration exposures on science data: It has also been confirmed that exposing the detector to intense illumination from calibration lamps affects observations conducted in the following evening. Figure 2 illustrates the actual cases.
Figure 3 show the comparison of persistence decay. The N2 camera shows a significantly slower declination of the signal compared to the other cameras. Because significant effects of persistence were observed both in the science data and in the calibration data of the N2 camera during the past semesters, the replacement of the detector was decided.
3. Impacts on science operation and the current schedule for resuming the N2 camera operation
Due to the detector replacement work, the observation schedule will be as follows:
- The PFS observation runs in S26A will be conducted as scheduled, except for the N2 camera, which is suspended throughout the semester.
- Replacement of the N2 camera will be done in S26A, and full camera operations will resume upon the first PFS run in the S26B semester.
4. Mitigation measures for allocated programs in the S26A semester
To minimize the impact of the N2 camera suspension on the S26A programs, the allocated times for the relevant proposals have been adjusted accordingly. In addition, we are exploring ways to optimize the planning software to allocate fibers with minimal impact on the scientific purposes of the programs. We plan to adopt this optimization once it becomes feasible.
Figures
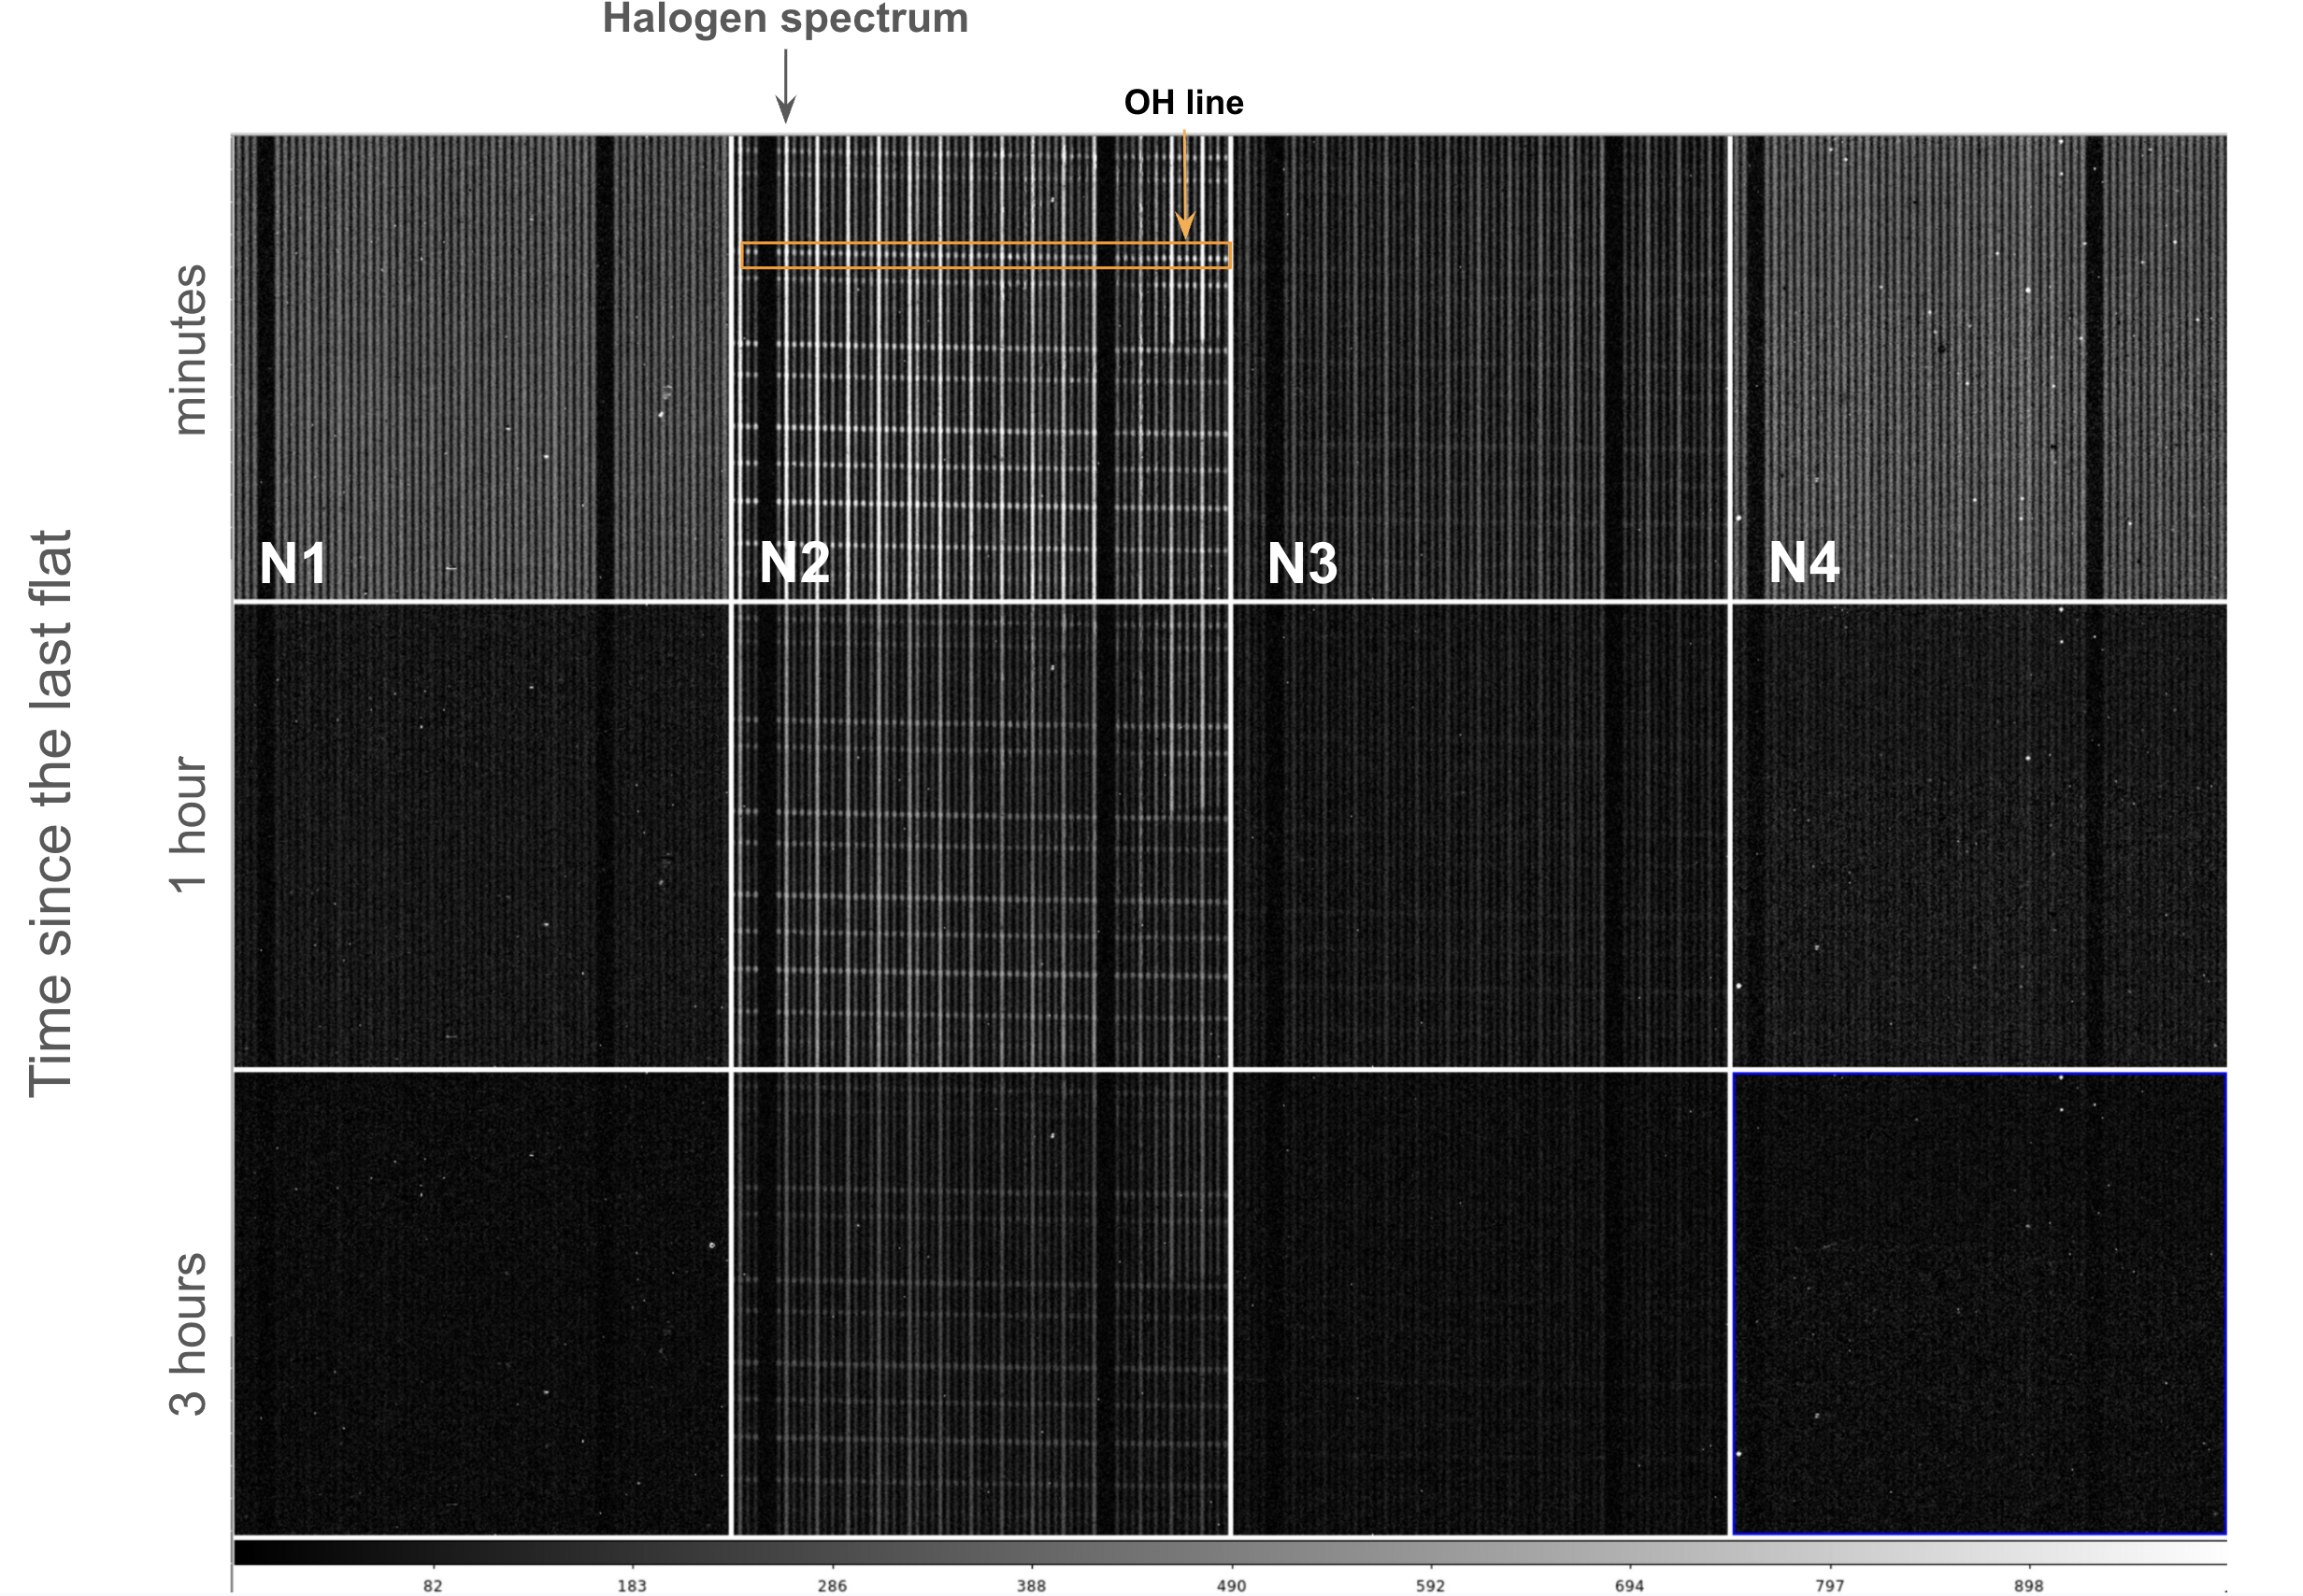
Figure 1: The time evolution of the persistence features in all near-infrared cameras.
These are 900-second dark frames taken after full-night observation and calibration data acquisition. From top to bottom, images just after calibration, at 1 hour, and at 3 hours are displayed. The vertical stripes are the persistence from halogen spectra, and the horizontal spots are from OH lines. The persistence feature of the N2 camera is clearly bright and persists longer than that of other spectrograph modules.
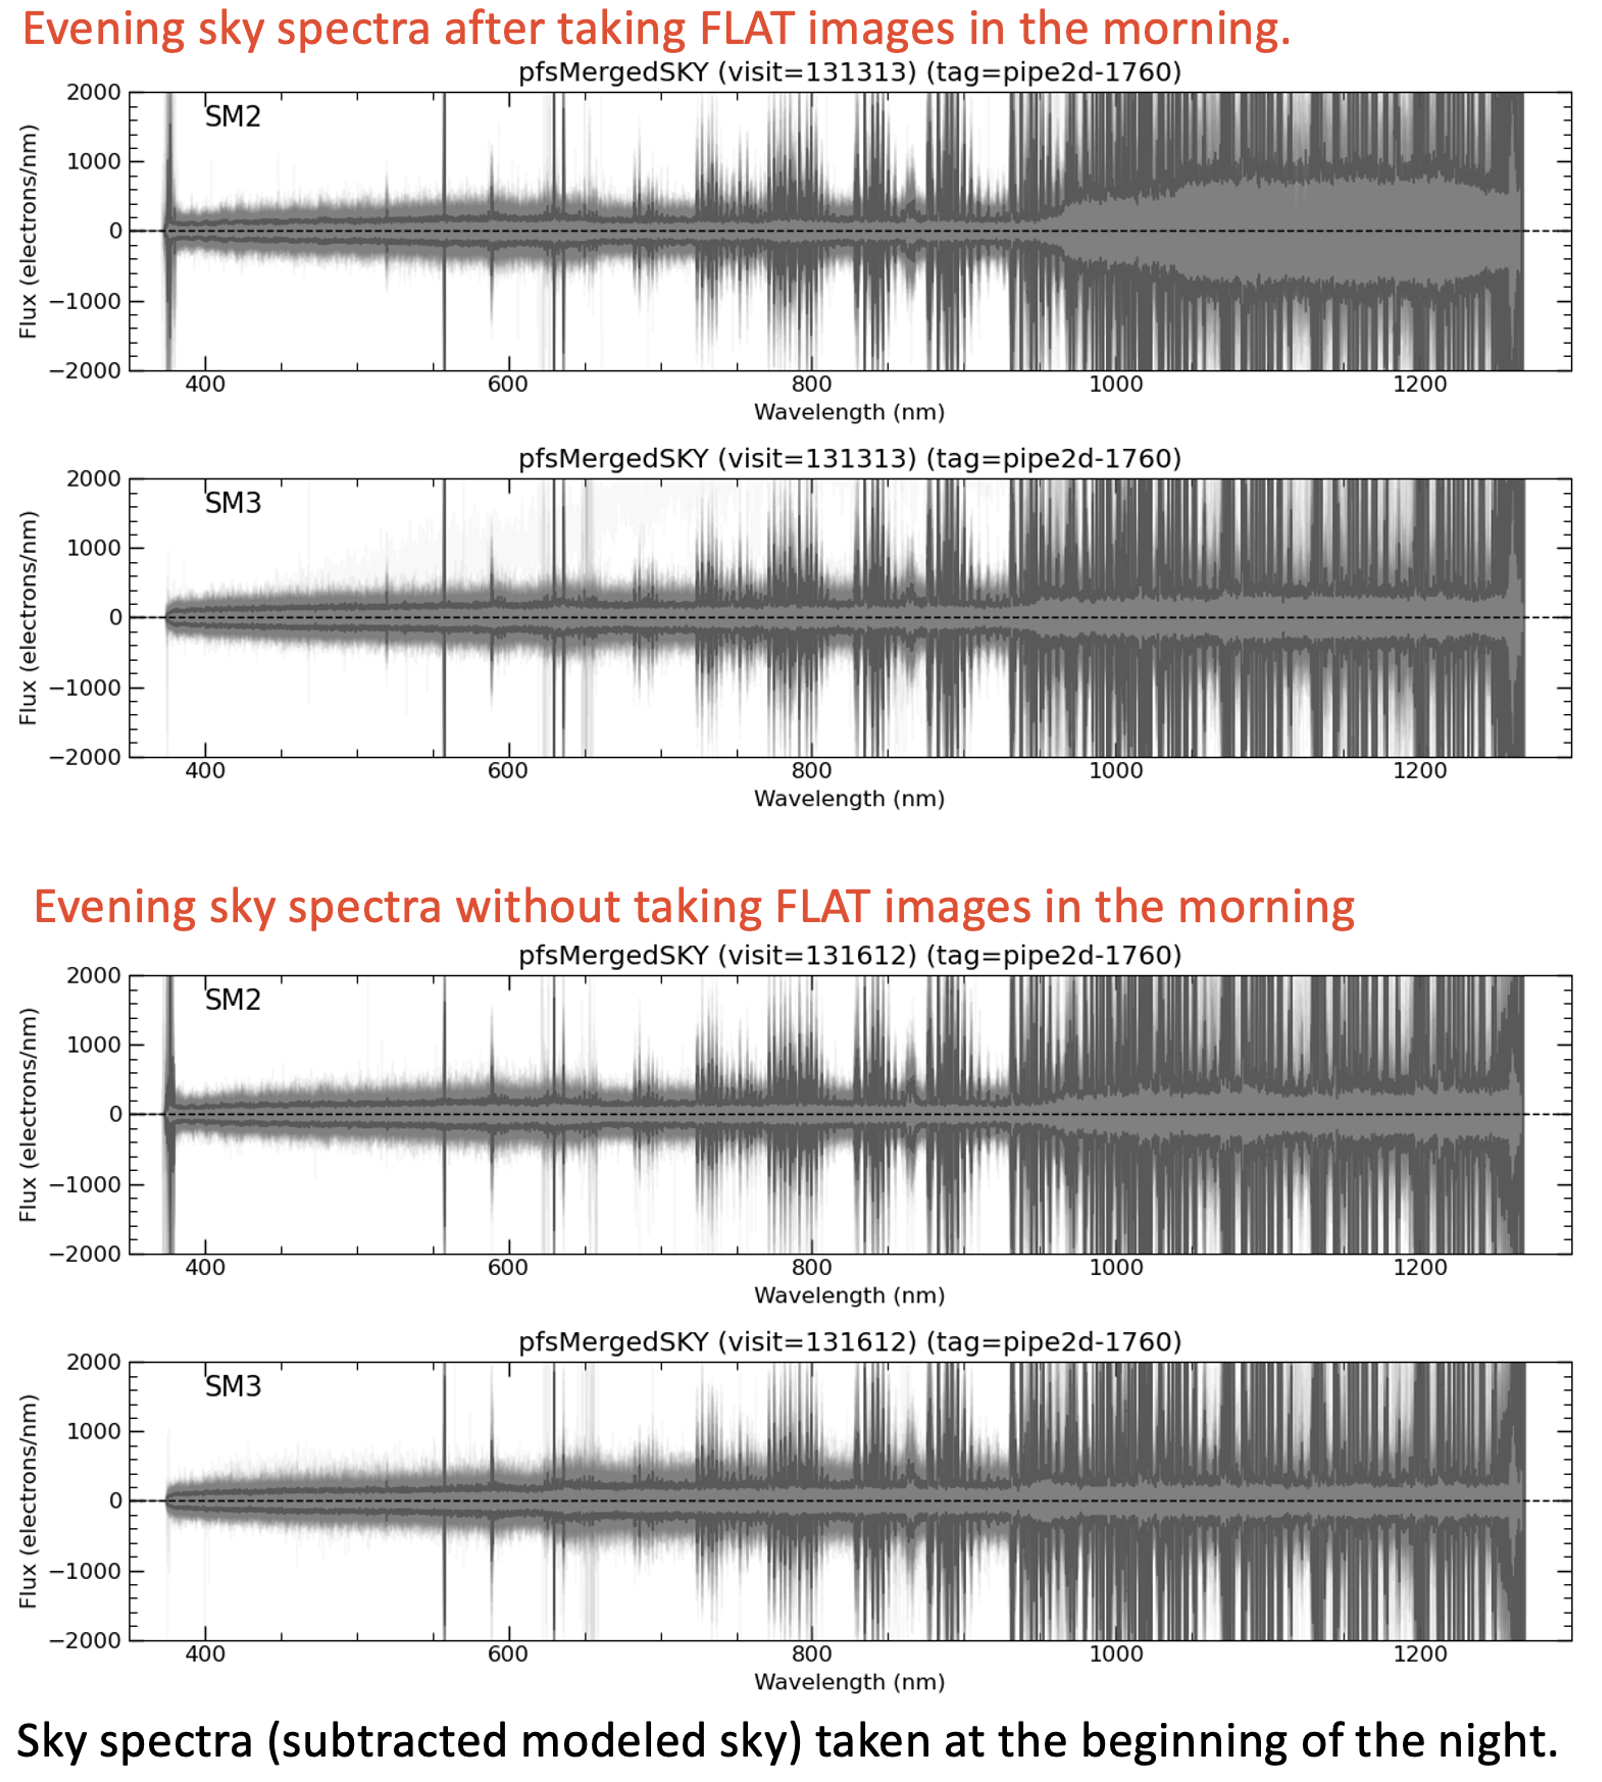
Figure 2: Impact of the calibration data taken in the morning on the next evening spectra.
Evening sky spectra obtained after taking FLAT in the morning were clearly affected by the persistence features in the near-infrared band of SM2.

Figure 3: Time Evolution of Persistence Intensity.
This plot illustrates the persistence signal intensity over time since the end of the last flat image (Figure 1). Compared to the typical performance of other detectors, the N2 camera (Orange) shows a significantly slower decay rate, retaining high residual signal levels for an extended period (over 5 hours).
Status of instrument (As of 2026/02/01)
All hardware but SM2 near-infrared camera is now online
Fiber throughput variation issue (updated)
We found that the relative fiber throughput changed in a time-scale of a few hours during a night due to the air gap between the fiber terminations in the fiber connectors. We decided to apply index-matching gel to fill the gap. Some tests in previous engineering runs show that the throughput stability has been significantly improved and the total throughput itself increased by several %. Throughput variation within the individual fiber patrol region is under study.
Flux non-uniformity across FoV
In past engineering runs, we found that for some exposures, especially those taken at low elevations (EL <~ 35 deg) and high elevations (EL >~ 70 deg), the non-uniformity of flux across the FoV was not small, causing the worst fibers to suffer substantial flux loss. This is possibly due to inaccuracies in fiber positioning, as well as the effects of field acquisition. We are continuing to improve the performance during engineering nights.
Auto Guide (AG) camera mount modification (new)
The large volume of observations in the past semesters revealed that the AG position is changing in both lateral and focal axes. The AG mount system is under an update, and the recalibration of the position (which requires on-sky data) is also underway.
Status of DRP development
PFS DRP Tutorial
PFS DRP Tutorial web page has been launched.
NIR data processing
The team is currently working on processing H4RG detector data while detrending various features incorporating the pixel-to-pixel and ramp-to-ramp analysis. We know that the strength and duration of the persistence depends strongly on the detectors, where the analysis is extremely difficult if the pixel traps many electrons in a level of saturation. We operate to avoid saturating the H4RG detectors and observe as less bright objects as possible. Since implementation for all these issues is ongoing, the obtained quality of spectra in the NIR region is not as good as the original ETC prediction.
Flux calibration and coadding exposures
As mentioned above, due to issues with significant flux loss and variation, there is large uncertainty in flux calibration for a portion of observations. The current performance of flux calibration is about several % rms in good cases. Although the stability of flux calibration has been gradually improving, we know there are some artifacts in coadded spectra and we have not yet fully verified the coadding performance of multiple exposures, and therefore the long integration performance for faint targets.
Scattered light correction
We know that there exists significant scattered light of several percent in amplitude. Currently, the intersection of fiber profile in the spatial direction (fiberProfiles) are generated without taking into account this effect and the wing of the profile is actually overestimated at a level of ~1%, therefore very bright fibers affect the spectral extraction of the neighboring fibers. We are currently planning to model the scattering kernel and apply in the processing, where we need to generate fiberProfiles in consistent way and apply both to the data in the extraction.
Sky subtraction accuracy
According to analysis of sky fibers, the chi distribution is close to the normal distribution N(0,1) in optical data. However, we found that a certain fraction of fibers shows significant over/under sky subtraction in sky lines, which is highly likely to be caused by fiber throughput changes depending on telescope/fiber configuration. The team is currently investigating this problem and planning subsequent implementation for improvement.
Wavelength calibration
The mapping between the position of a fiber and the wavelength and the position on the detector (detectorMaps) is calibrated using quartz and arc lamps data. In order to correct the small change due to various changes of instrument condition, we adjust it using sky lines in each exposure. The typical uncerntainty of detectorMaps is at a level of 0.05 pixel in both spatial and wavelength direction.
Cosmic ray rejection
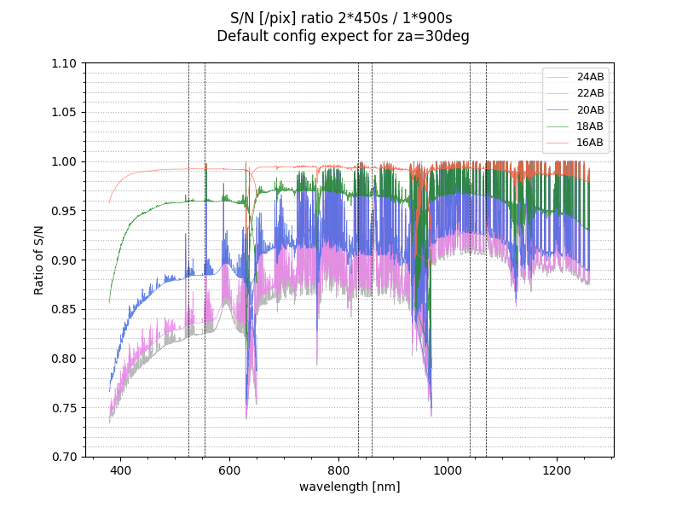
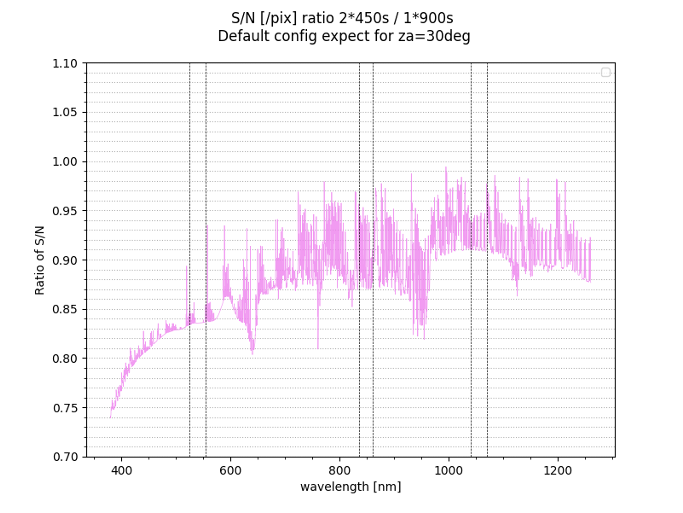
Currently it is hard to detect all CRs in a single exposure of CCDs. Unmasked CRs affect data reduction, particularly sky subtraction. For now, we use multiple frames (at least 2 frames) to detect almost all CRs and process further. Due to this requirement, at least 2 exposures must be taken for the same fiber design. The figures below show the expected degradtion on SNR due to splitting the exposure time (the left is for continuum and the right is for emission line).
Performance verification
Fiber configuration accuracy
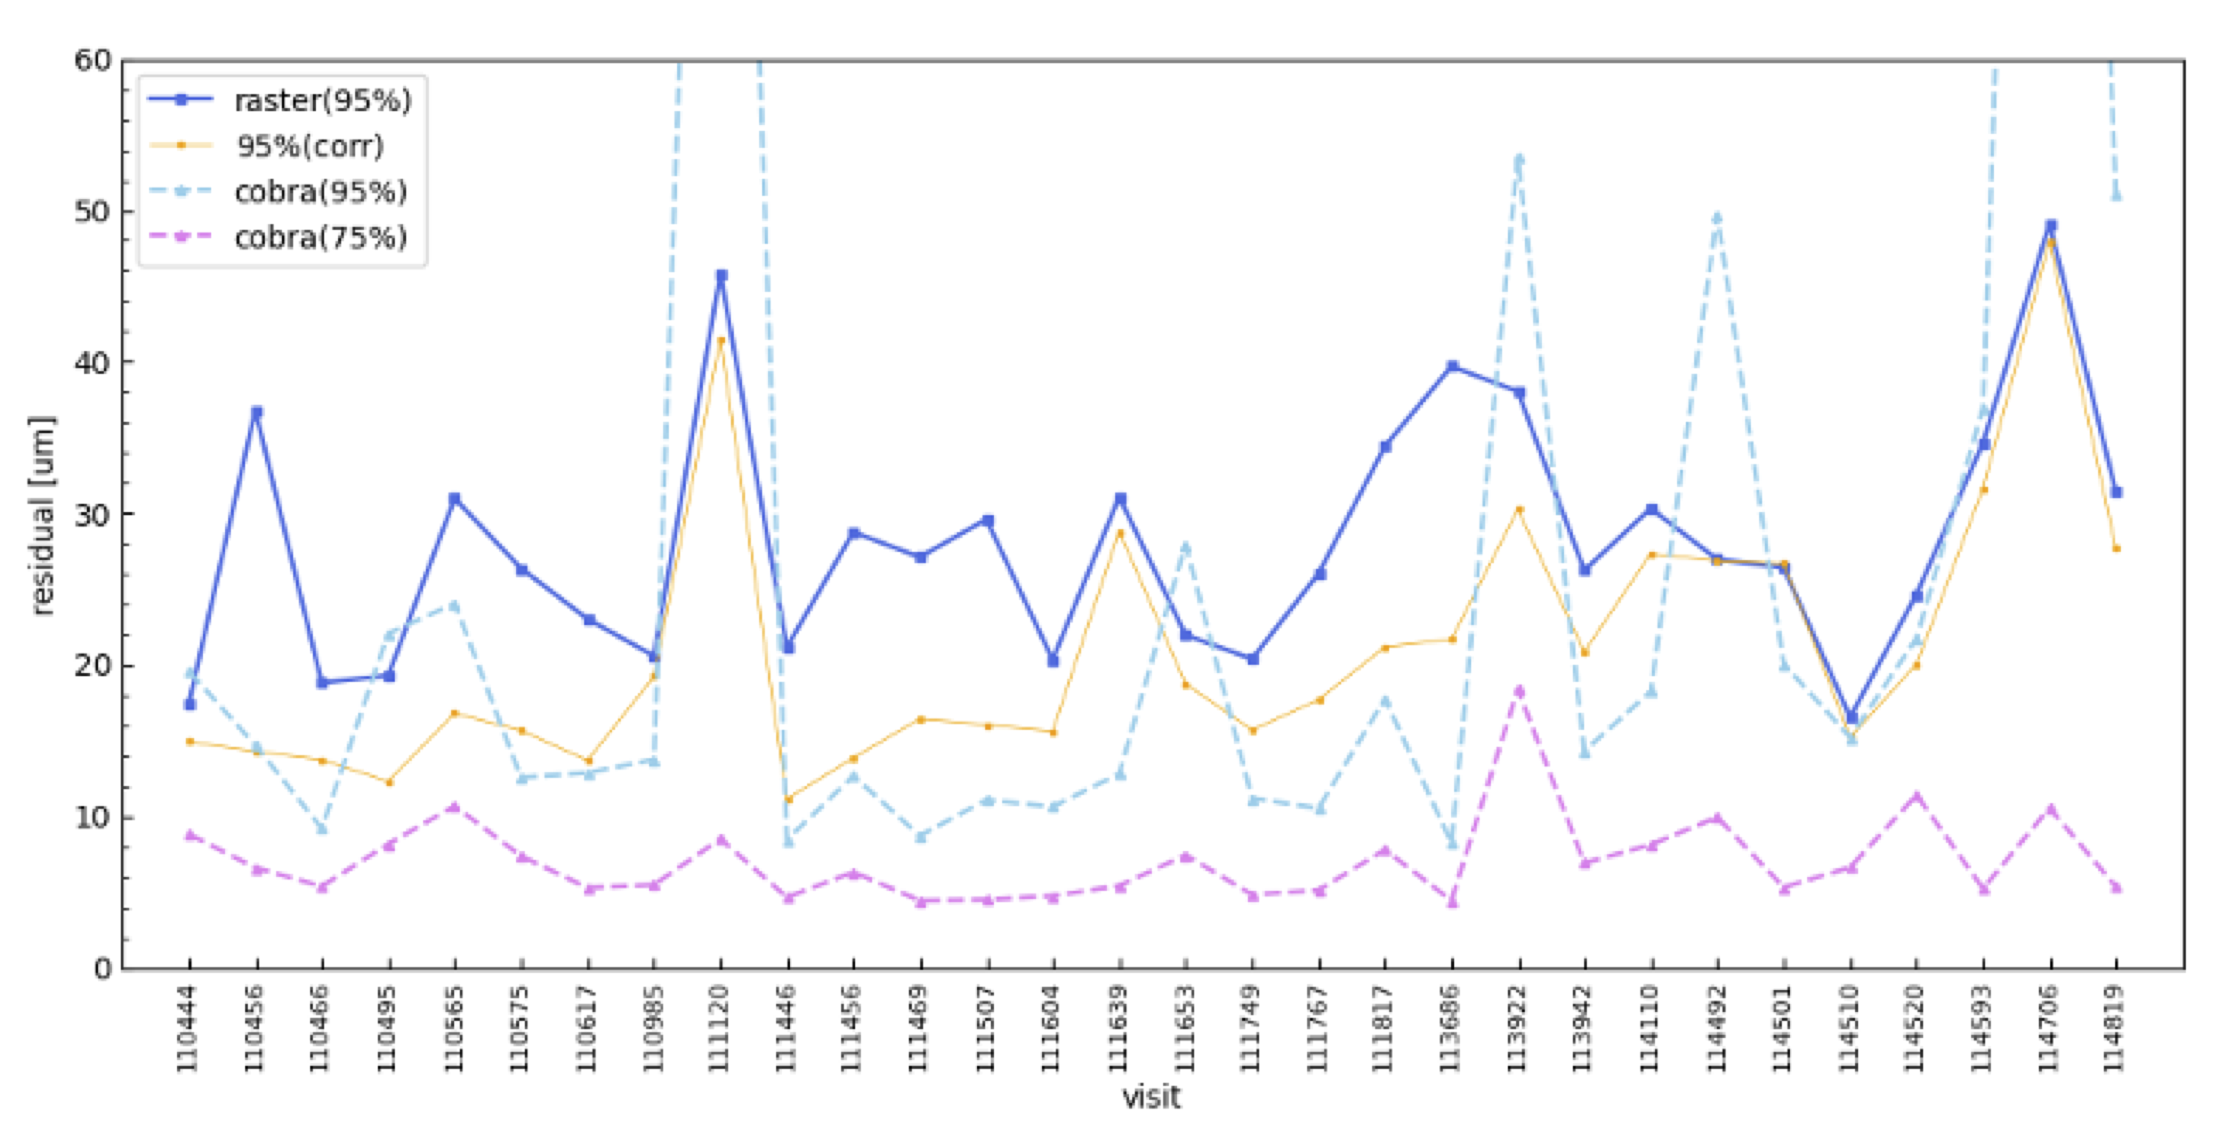
The fiber configuration is carried out by comparing target and fiber positions on PFI using images taken by MCS in an iterative way. Based on results in previous engineering runs, the configuration performance achieves an accuracy of < 10 μm (75%-tile). The configuration time is approximately 120 sec in the best case. The final positional accuracy, including the uncertainty from coordinate transformation and field acquisition, have been measured using a method called raster scans and the typical accuracy is < 30 μm (95%-tile). The figure below shows the average residual for each visit.
System throughput
Based on data of bright Calspec stars and F-type stars for the flux calibration, we confirmed that the system throughput is basically consistent with the expectation integrating observed/laboratory data of each sub-system component, which is now incoporated in the current version of ETC. Note that the throughput has been adjusted based on data obtained in S25A and slight improvement in throughput enhancement thanks to the index-matching gel should now be included in ETC.
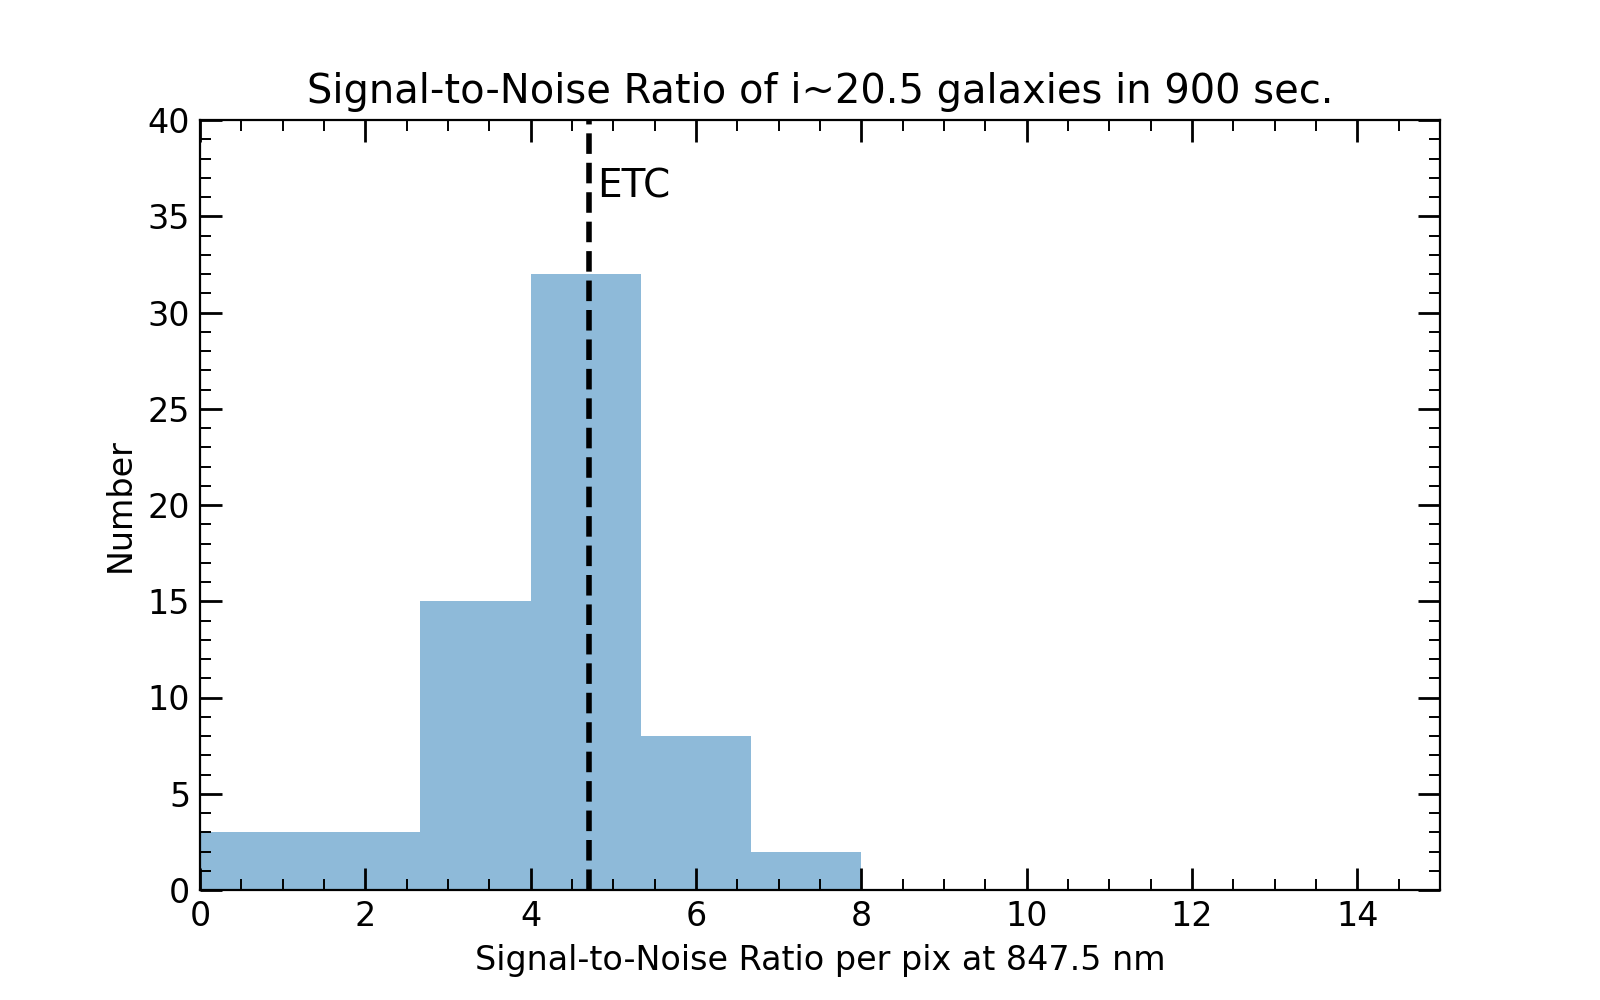
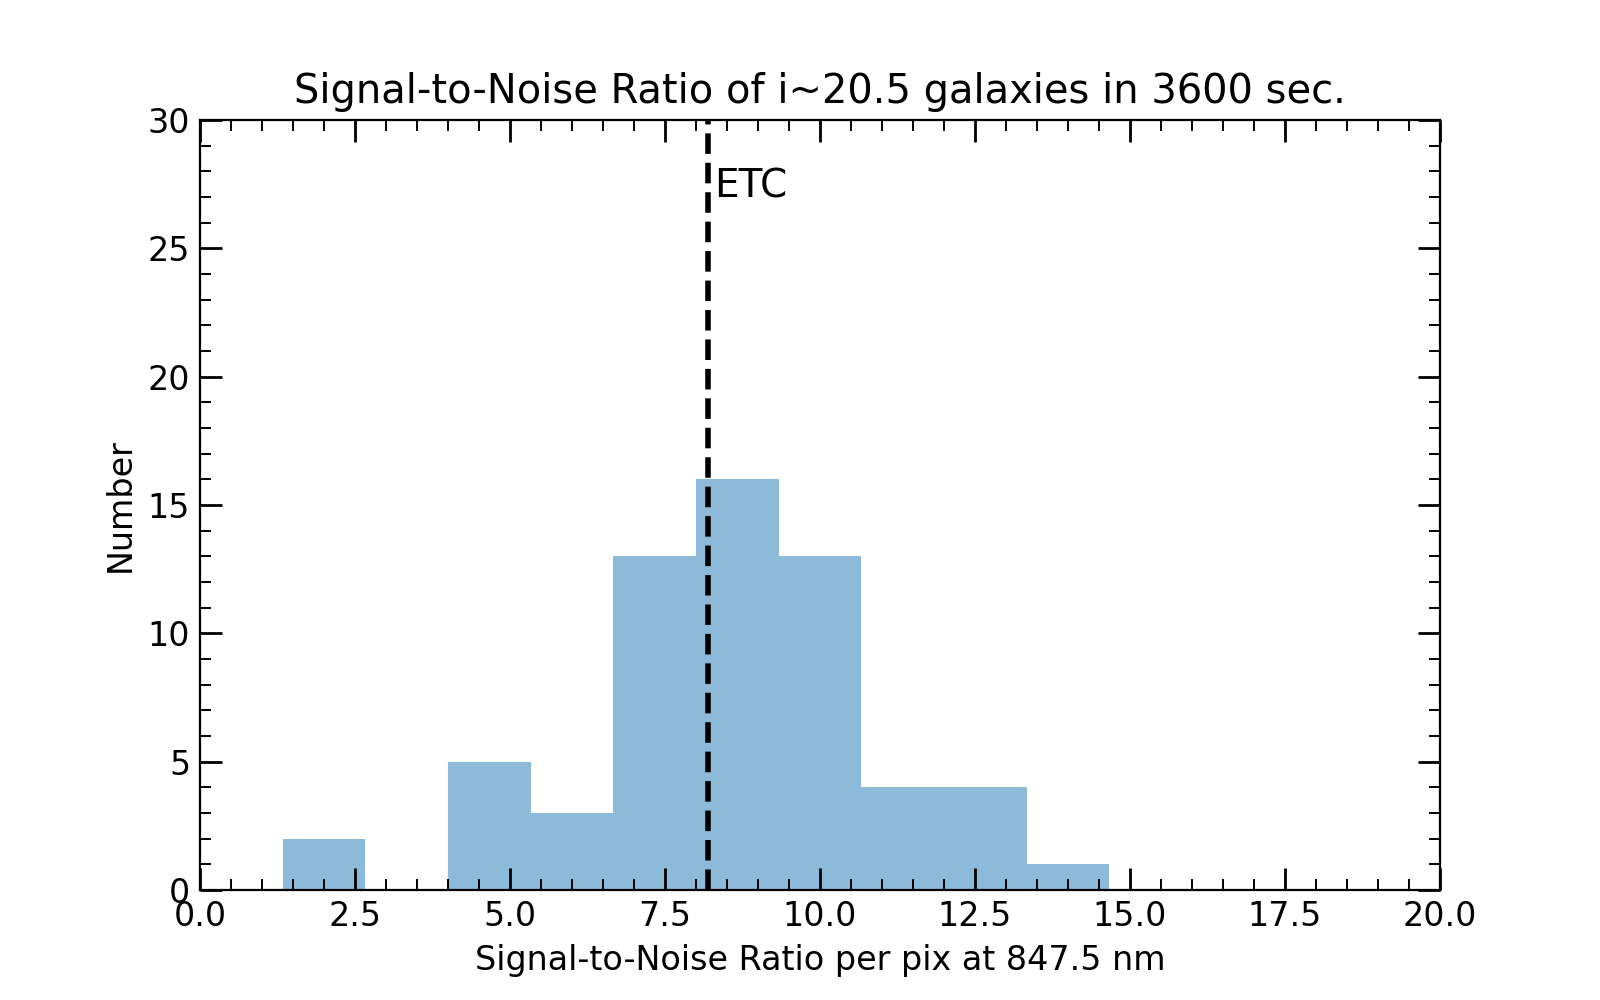
Signal-to-Noise Ratio
Based on the current capability of DRP, we confirmed that the signal-to-noise ratio against relatively bright galaxies is mostly consistent with the expectation of ETC for a single exposure and/or integration up to ~1 hour in optical arms. Regarding longer integrations of fainter objects, we have not verified that the signal-to-noise increases as coadding multiple exposures, since there is still uncertainty in the flux calibration and coadding process. The left figure below shows the SNR for 20.5 ABmag galaxies for a single 900 sec exposure and the right figure shows it for adding four 900 sec exposures. The vertical dashed line represents the expectation of ETC for similar observing conditions.
ETC update
Based on observations in S25A, the ETC performance was adjusted so that the noise and throughput in ETC are statistically consistent with actual measurements based on sky fibers and flux-standard fibers in the nominal condition. There is slight improvement in optical wavelength, but since the improvement of NIR reduction is still in progress as mentioned above, the performance is currently degraded in NIR wavelength region.