Report on signal-to-noise ratio accuracy of HSC ETC
Released in July 2021, by M. Simunovic and T. Terai
The HSC Exposure Time Calculator (ETC) has recently been updated to improve the accuracy of signal-to-noise ratio (SNR) estimation. This report describes our evaluation of the latest HSC ETC as of July 2021 (version 2.2) using HSC observation data obtained mostly in early 2018 which is shortly after the primary mirror recoating (see the Transparency plot here).
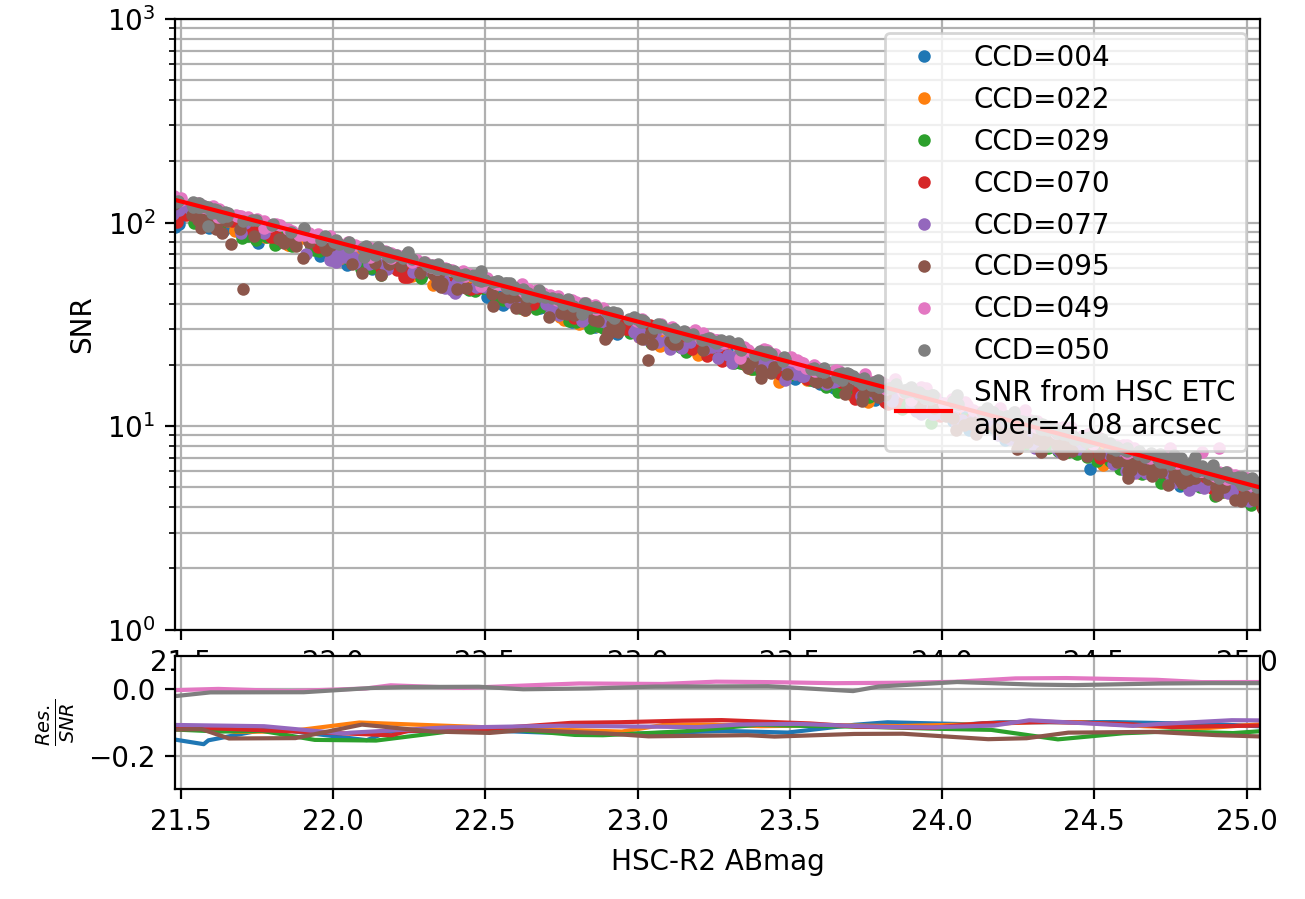
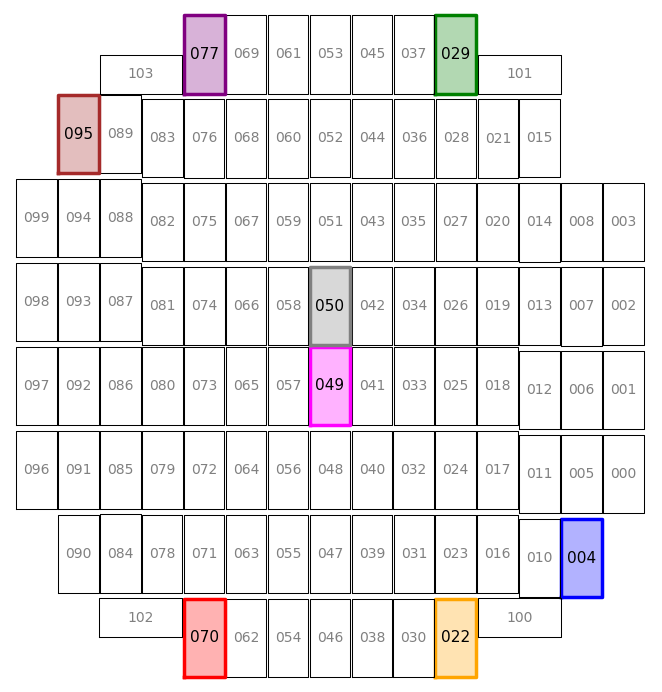
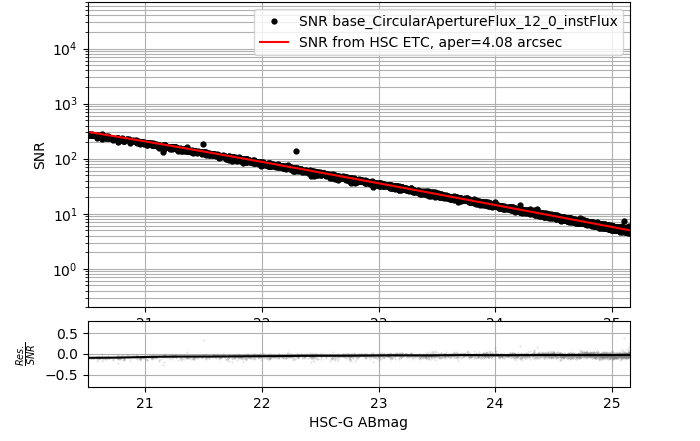
The data were reduced with the HSC pipeline (hscPipe) version 7 and the measured fluxes of detected point-sources were obtained from the resulting SRC catalogs. For each point-source in a set of 16 CCDs near the center of the field-of-view, the SNR within a circular aperture was calculated using the expression
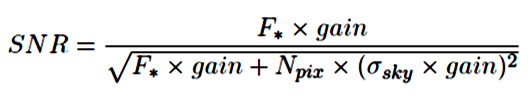
where F∗ is the flux in ADU from the 12 pixel circular aperture (derived from “base_CircularApertureFlux_12_0_instFlux” in the SRC catalog), Npix is the number of pixels within the aperture, and σsky is the standard deviation of the local sky level (derived from “base_LocalBackground_instFluxErr” in the SRC catalog). Each source's magnitude was calculated using the hscPipe routines getPhotoCalib for photometric calibration and instFluxToMag to transform the flux into AB magnitude.
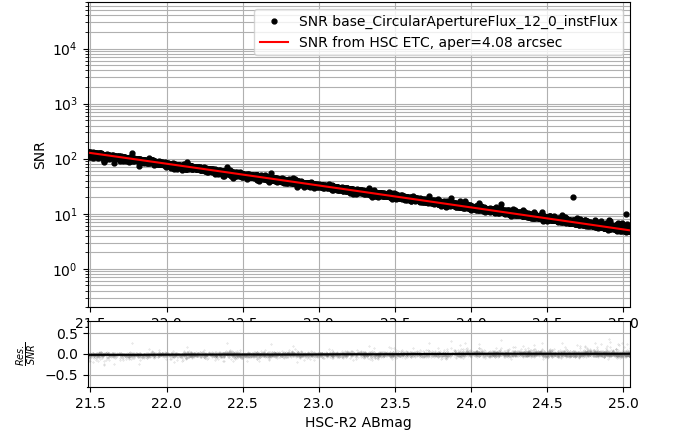
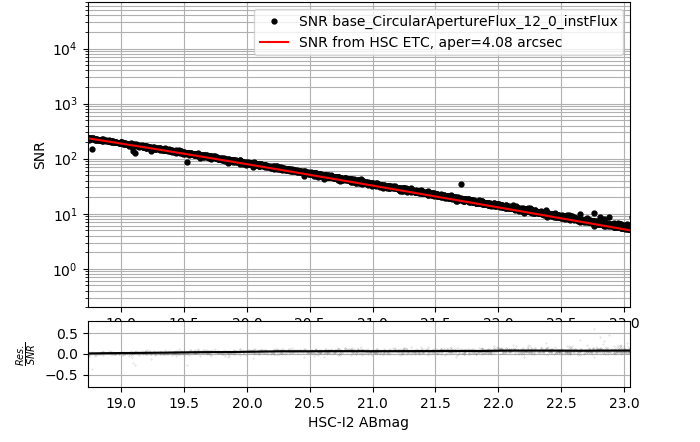
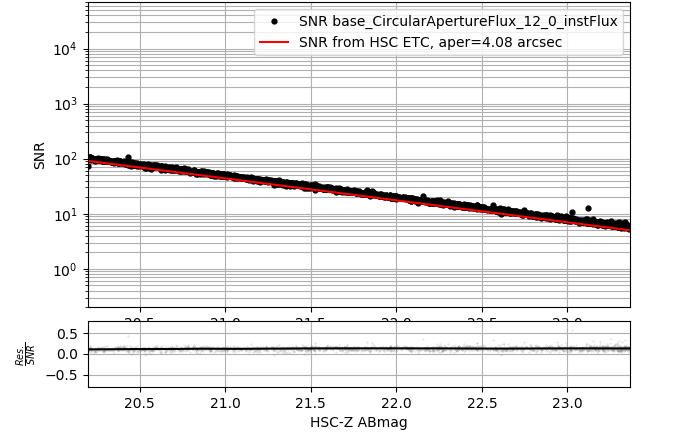
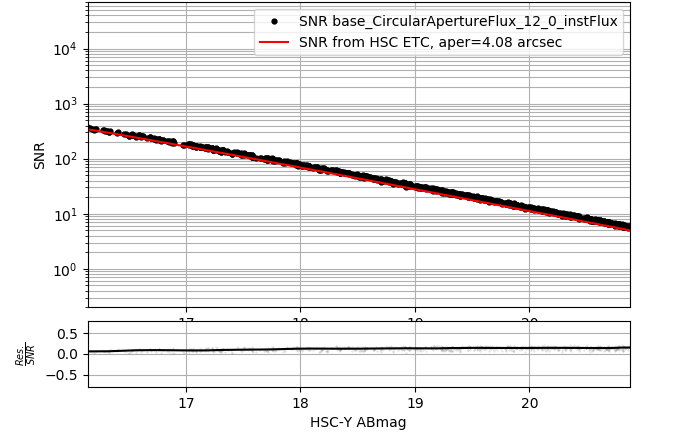
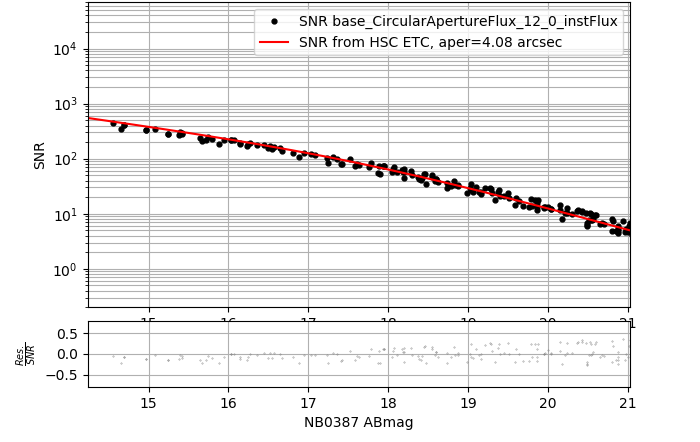
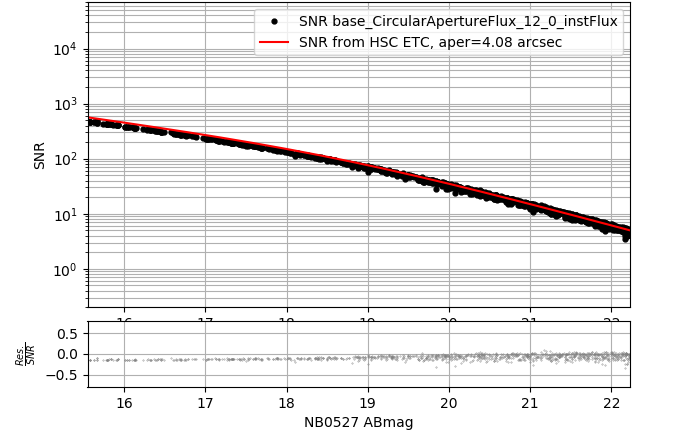
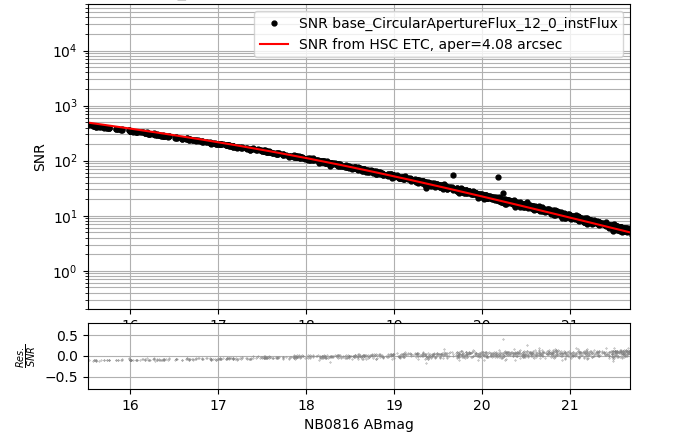
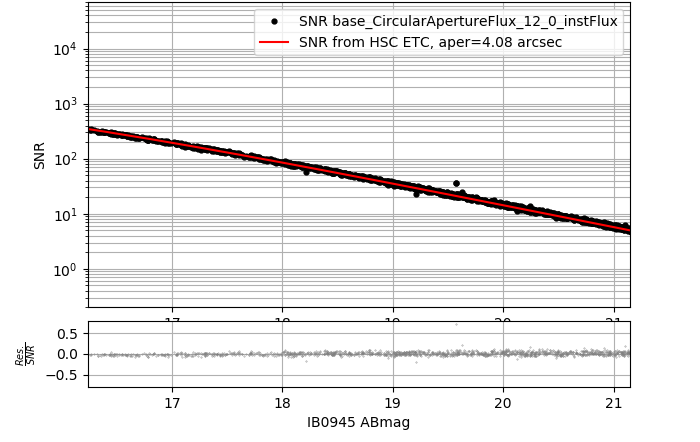
The figures below show the comparisons of SNR measured with the above equation against SNR estimates from the ETC for the corresponding observing conditions (i.e., seeing, transparency, and moon phase/distance) within a circular aperture of a 4.08 arcsec diameter (= 12 pixels in radius). The horizontal axis range is determined to be between the saturation and limiting magnitude values reported by the ETC. Although the ETC might underestimate or overestimate the SNR slightly due to the specific observing condition such as the sky level, overall the figures show that the ETC is able to accurately estimate the SNR within a few percent for the entire dynamic range of the detector, which suggests that the systematics and noise sources have been properly modeled in the ETC algorithm.
Broad-band filters
-
HSC-g data in January 2018: exptime = 150 sec, seeing = 0.86″, transp = 1.00, sky level = 4.0 ADU/sec
-
HSC-r2 data in January 2018: exptime = 300 sec, seeing = 0.77″, transp = 1.00, sky level = 10.2 ADU/sec
-
HSC-i2 data in January 2018: exptime = 30 sec, seeing = 0.61″, transp = 1.00, sky level = 19.4 ADU/sec
-
HSC-z data in March 2018: exptime = 300 sec, seeing = 0.73″, transp = 0.94, sky level = 18.8 ADU/sec
-
HSC-Y data in January 2018: exptime = 30 sec, seeing = 1.31″, transp = 0.60, sky level = 35.7 ADU/sec
Narrow-band filters
-
NB0387 data in January 2018: exptime = 30 sec, seeing = 0.80″, transp = 0.99, sky level = 0.1 ADU/sec
-
NB0527 data in March 2018: exptime = 30 sec, seeing = 0.86″, transp = 1.00, sky level = 0.3 ADU/sec
-
NB0816 data in April 2018: exptime = 30 sec, seeing = 0.68″, transp = 1.00, sky level = 0.6 ADU/sec
-
IB0945 data in December 2018: exptime = 30 sec, seeing = 0.69″, transp = 1.00, sky level = 11.7 ADU/sec
SNR decline at the edge of field-of-view
- HSC-r2 data in January 2018: exptime = 300 sec, seeing = 0.77″, transp = 1.00, sky level = 10.2 ADU/sec