Coronagraphic Low Order Wavefront Sensor
High accuracy measurement and control of low order aberrations in a coronagraph
Coronagraphic Low Order Wavefront SensorHigh accuracy measurement and control of low order aberrations in a coronagraph |
|
Home |
Show content only (no menu, header)Low order aberrations and high performance coronagraphyHigh performance coronagraphs, such as the PIAA coronagraph, are very sensitive to small errors in tip-tilt and other low order wavefront aberrations (such as focus and astigmatism). There is a fundamental relationship between the Inner Working Angle of a coronagraph (how close to the star it can image a planet or disk), the contrast ratio at which it is operating, and its sensitivity to low order aberrations: detection of high contrast sources very close to the optical axis requires exquisite control of low order aberrations. This is fundamentally due to the fact that the wavefront from a source close to the optical axis is very similar to a low order aberration on the star wavefront.Efficient operation of high performance coronagraphs therefore requires control of low order aberrations well beyond what is typically required for imaging systems. On the 0.7m diameter EXCEDE, achieving the full coronagraph performance (1e-6 contrast at 1 λ/D) requires control of tip-tilt to about λ/100, equivalent to a ~2 milliarcsecond angle on the sky in B band. Other low order modes (Focus, astigmatism) have similar requirements. Tip and tilt are the most challenging low order aberrations, as they can easily be produced by pointing error, thermal effects and vibrations in the optical train. The key to controlling these aberrations is to continuously measure them and use this information to :
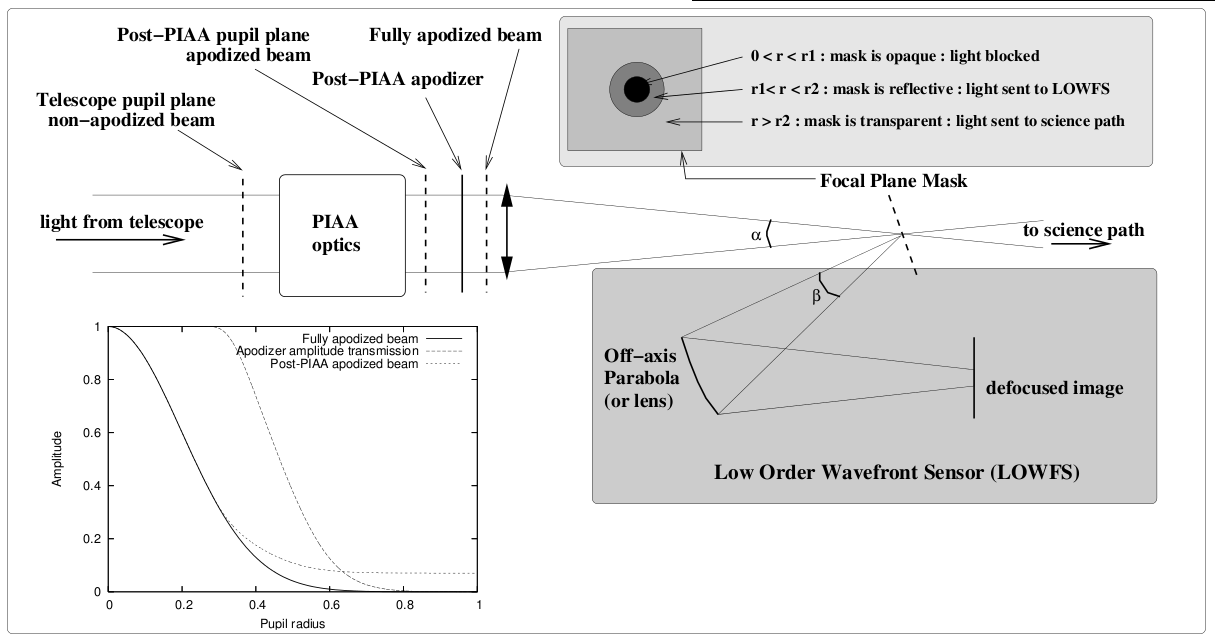
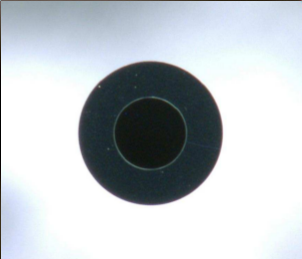
The Coronagraphic Low Order Wavefront Sensor (CLOWFS) conceptMost coronagraph concepts use a focal plane mask to block starlight. The bright starlight falling on the mask is not used for science, and is therefore available for low order eavefront sensing. Low order aberrations are actually best sensed using this light, as they will deform the central PSF core (for example, tip-tilt will move the PSF core). The CLOWFS therefore uses this light, which is reflected to a fast camera, to measure these aberrations. In the CLOWFS concept, two hardware improvements to this simple scheme improve sensitivity and robustness:
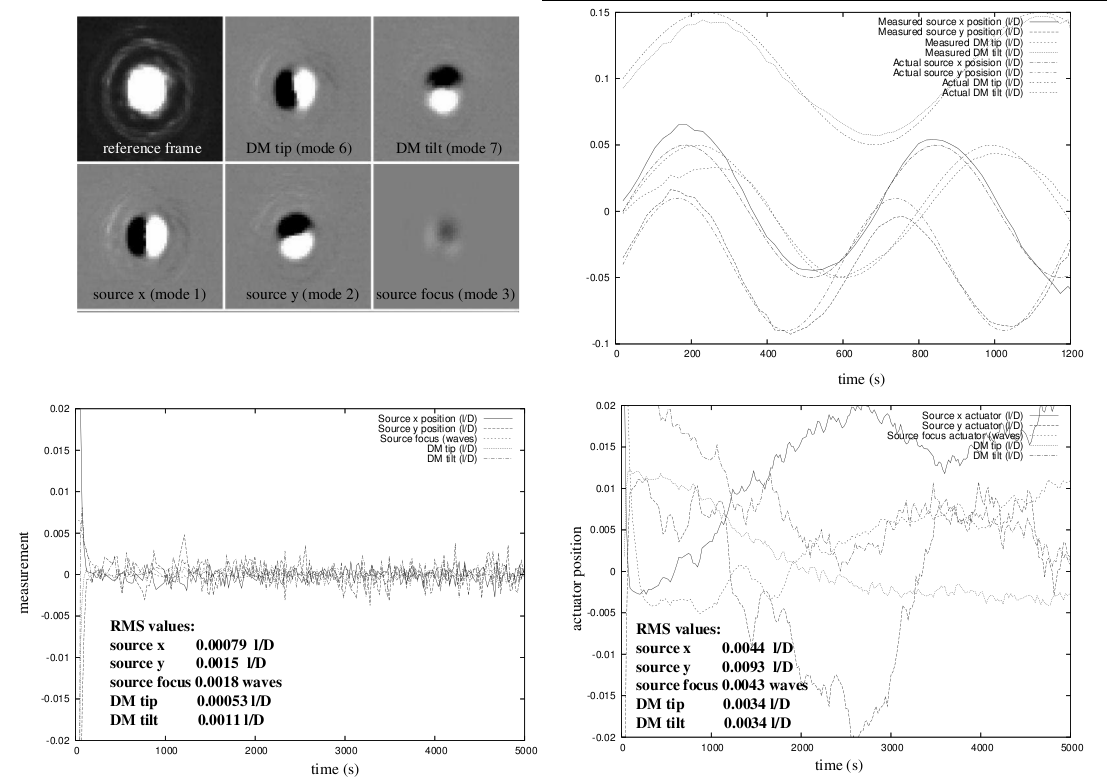
LOWFS algorithm, performance and design optimizationThe LOWFS is a linear sensor. To calibrate the LOWFS, actuators are moved (for example tip and tilt) while the LOWFS records the corresponding modes in the image. These modes are used as calibration to analyze all LOWFS images. A simple linear decomposition of LOWFS images into the sum of a reference image and the LOWFS modes yield the values of the corresponding low order aberrations. This algorithm is fast (linear) and does not rely on modeling of the LOWFS response (which is measured, not modeled).The LOWFS allows measurement of tip-tilt close to the theoretical fundamental limit of 1/(sqrt(N) π) λ/D (single axis, 1-σ), with N the total number of photon in the beam ahead of the focal plane mask. A detailed analysis of the LOWFS is provided in Guyon et al. 2010, along with a quantitative description of how the LOWFS design parameters affect its performance. An example result of this analysis is shown in Fig. 3, where the sensitivity for different low order aberrations is shown as a function of relative size of the inner opaque disk to the reflective annulus, and of the defocus distance in the LOWFS camera. Past and Existing LOWFS+PIAA systemsThe LOWFS was first implemented on a PIAA coronagraph testbed at the Subaru Telescope. This fist prototype achieved 1e-3 λ/D closed loop tip-tilt control in air with a PIAA coronagraph and a 1Hz sampling frequency (results shown in Fig 3). A second faster LOWFS is now also in operation on the Subaru Coronagraphic Extreme Adaptive Optics (SCExAO) system, and is running at 100Hz sampling frequency in near-IR for ground-based coronagraphy. LOWFS systems are also in preparation for the PIAA coronagraph at the High Contrast Imaging Testbed at NASA JPL and the NASA Ames PIAA testbed.
Page content last updated: 27/06/2023 06:35:52 HST html file generated 27/06/2023 06:34:36 HST |