Users can simulate echelle spectrum formats by accessing this Web page. No simulator is available for the long-slit mode.
From the "Setup:" menu in the "Instrument setting" part the user can choose one of the standard spectrograph's setups, optimized for various wavelength regions, from UV to near IR. We strongly recommend usage of one of them, instead of a non-standard setup. However, if user decides to use a non-standard setting, the echelle format can be simulated with the instrument settings determined below. User can change between red and blue collimator and cross disperser, their cross scan angles, echelle grating inclination and detector rotation. In this part also the slit length may be set manually.
If the user is interested in particular spectral features, their location on the CCD chips may also be simulated. In the "Remarkable Lines" section, one can put a number of interesting lines, giving their name and wavelength. The redshift may also be set. User can also choose one of the pre-defined lists of lines given below.
Once the setup and lines are defined, click the "Calculate Format" button.
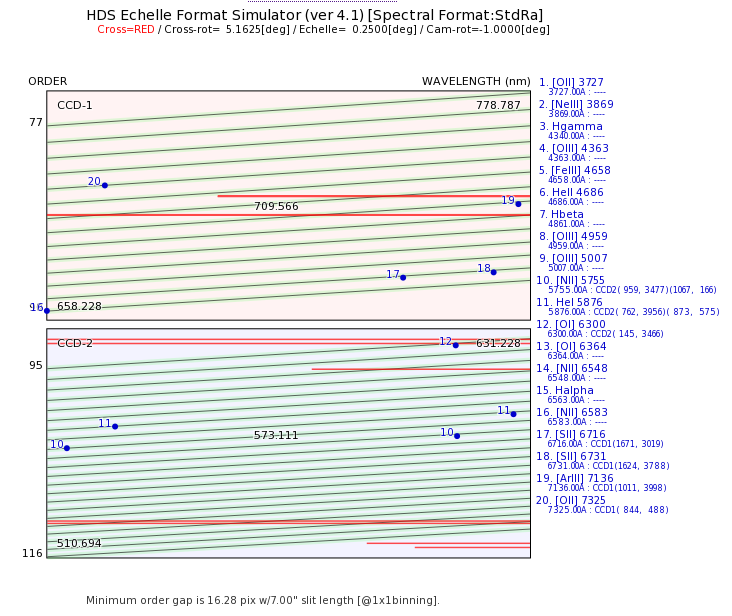
Figure ![[*]](crossref.png) shows
an example of the result of the calculation.
Two images are produced: (a) the location of orders, selected lines,
and wavelength range on the CCD detectors;
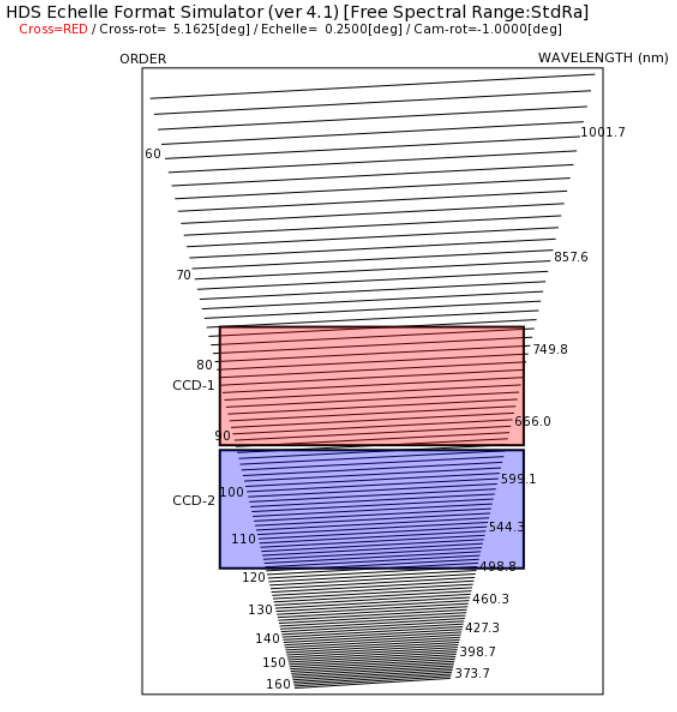
(b) the location of the CCD detectors over the full spectral
format, with the free ranges plotted. One can see which echelle
orders, representing which wavelengths can be recorded on the CCDs.
The first image also shows the location of bad CCD columns, marked
with red lines.
shows
an example of the result of the calculation.
Two images are produced: (a) the location of orders, selected lines,
and wavelength range on the CCD detectors;
(b) the location of the CCD detectors over the full spectral
format, with the free ranges plotted. One can see which echelle
orders, representing which wavelengths can be recorded on the CCDs.
The first image also shows the location of bad CCD columns, marked
with red lines.
Both output images are also available as pdf documents.
 |
 |
Additional software for off-line calculation of the spectrum format is prepared
for the determination of the setup parameters (HDS_SPFv20.f or
HDS_SPFv20wopg.f). The source program is written in Fortran 77
and PGPLOT is used to plot the result (optional). The source program is
available in the Web site:
http://optik2.mtk.nao.ac.jp/HDS/index.html
See the README_SPen file in the same site for details.