σ2D [λ/D] = sqrt(2)/(π sqrt(Nph)) = 0.450/sqrt(Nph) | (equ A.1.1) |
---|
σ1D [λ/D] = 1/(π sqrt(Nph)) = 0.318/sqrt(Nph) | (equ A.1.2) |
---|
(1/σx)2 = SUMx,y (1/σpixel x,y)2 = SUMx,y( (d(PSF(x,y))/dx)2 / PSF(x,y) ) | (equ A.1.3) |
---|
![]() |
Fig A-1: Impact of spectral bandwidth on PSF shape.
[jpg]
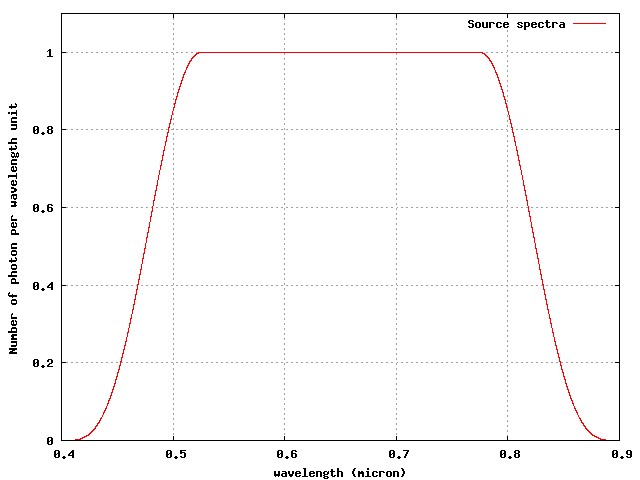
Monochromatic PSF (top left), x = 0.1 (top right, approximately 20% wide spectral band), x = 0.2 (bottom left, approximately 40% wide spectral band) and x = 0.4 (bottom left, approximately 80% spectral band). In each case, the spectra is flat in dlambda, and extends from lambda0/(1+x) to lambda0*(1+x). The sampling is 10x Nyquist at the central wavelength. |
![]() |
Fig A-2: Loss of photon noise limited astrometric measurement accuracy as x (roughly equal to half the spectral bandwidth) increases.
[jpg]
[ASCII data]
The data was computed at 10x Nyquist at the central wavelength, with equation (A.1.3) used to compute the astrometric error due to photon noise. Polychromatic PSFs are computed as an incoherent sum of 50 monochromatic PSFs, each scaled to the same physical plate scale. |
![]() |
Fig A-3: Example PSFs with different detector sampling.
[jpg]
0.5x Nyquist (top left), 1x Nyquist (top right), 2x Nyquist (bottom left) and 4x Nyquist (bottom left). In each case, the PSF is monochromatic and the PSF center is randomly set to a non-integer pixel coordinate. |
![]() |
Fig A-4: Single axis photon noise limited astrometric measurement accuracy as a function of detector sampling.
[jpg]
[ASCII data]
Monochromatic simulation. At small sampling, the points fan out between a lower boundary corresponding to the "quad cell" case where the PSF center falls at the corner of 4 pixels (and the astrometric error becomes independent of sampling, as shown by the flatness of this lower boundary), and an upper boundary where the PSF is centered on a pixel. |
σ1D [λ/D] = (1/sqrt(Nph)) x (1/π + 0.1 x SamplingFactor-1.2) | (equ A.3.1) |
---|
![]() |
Fig A-5: Spectra adopted for this work (number of photon per wavelength unit).
[jpg]
The spectra covers the 0.4 to 0.6 micron region. Half of the number of photon is at λ<0.65μm. Half of the energy is contained at λ<0.625μm. When listing angles in λ/D unit in this document, λ is assumed to be 0.6 μm. |
![]() |
Fig A-6: Single axis photon noise limited astrometric measurement accuracy as a function of detector sampling for a polychromatic measurement (with the spectra shown in Figure A-5).
[jpg]
[ASCII data]
There is little gain beyond Nyquist sampling. |
![]() |
Fig A-7: 1D Photon noise limited astrometric accuracy in the presence of wavefront aberrations (monochromatic light).
[jpg]
Simulation performed with sampling = 2x Nyquist. |
![]() |
Fig A-8: 1D Photon noise limited astrometric accuracy in the presence of wavefront aberrations (polychromatic light).
[jpg]
Simulation performed with sampling = 2x Nyquist. |
![]() |
Fig A-9: Monochromatic PSF with 2 rad RMS trefoil aberration.
[jpg]
As shown in Figure A-7, this aberration does not reduce astrometric accuracy in monochromatic light: in the photon noise limit, the astrometric measurement will be as accurate as for a perfect PSF (Airy pattern). In polychromatic light, Figure A-8 shows that astrometric sensitivity is slightly reduced with this aberration. |