
| |
Figure 1: Two example of PIAA coronagraph system architectures. Both architectures use a set of aspheric optics (top left) to perform lossless apodization of the telescope beam. The minimum PIAA coronagraph system (top right) consists of a PIAA apodization unit introduced before the instrument's focal plane detector array. A full PIAA coronagraph system (bottom) can also include an apodizer, a focal plane mask, a pupil stop and an inverse PIAA optics unit. |
 |
Figure 2: Five possible PIAA coronagraph architectures, approximately ordered from top to bottom in increasing performance and manufacturing ease. |
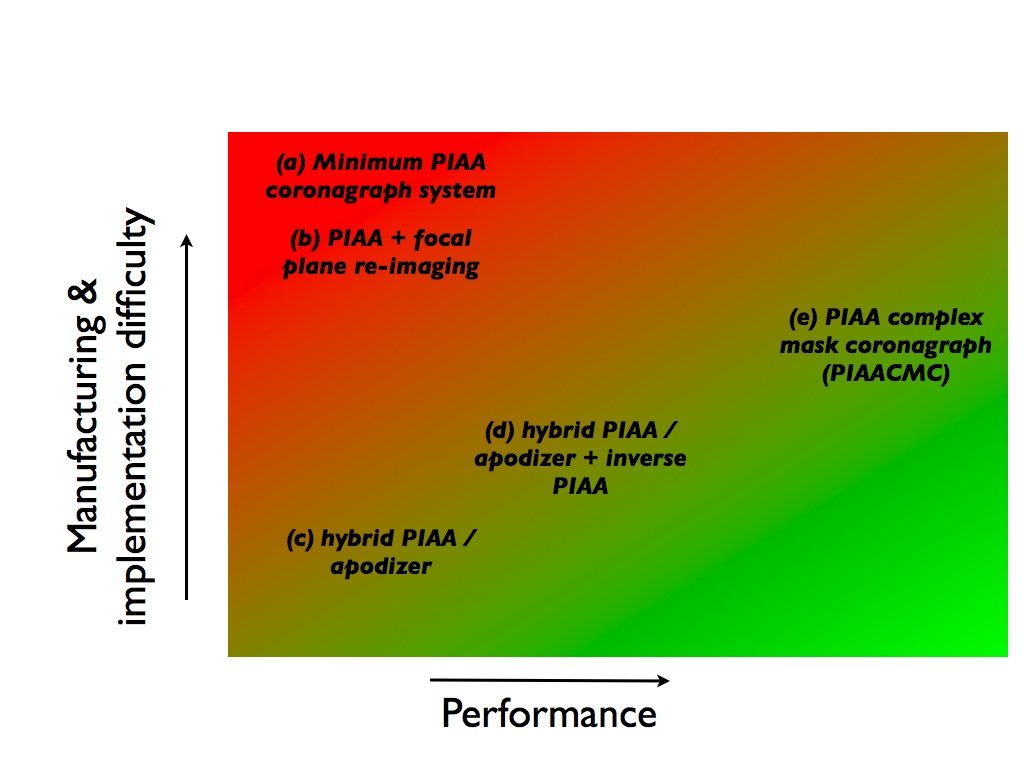 |
Figure 3: Approximate location of the five architectures shown in Figure 2 on a 2-D plane with performance (x axis) and degree of technical difficulty (y axis) coordinates. |
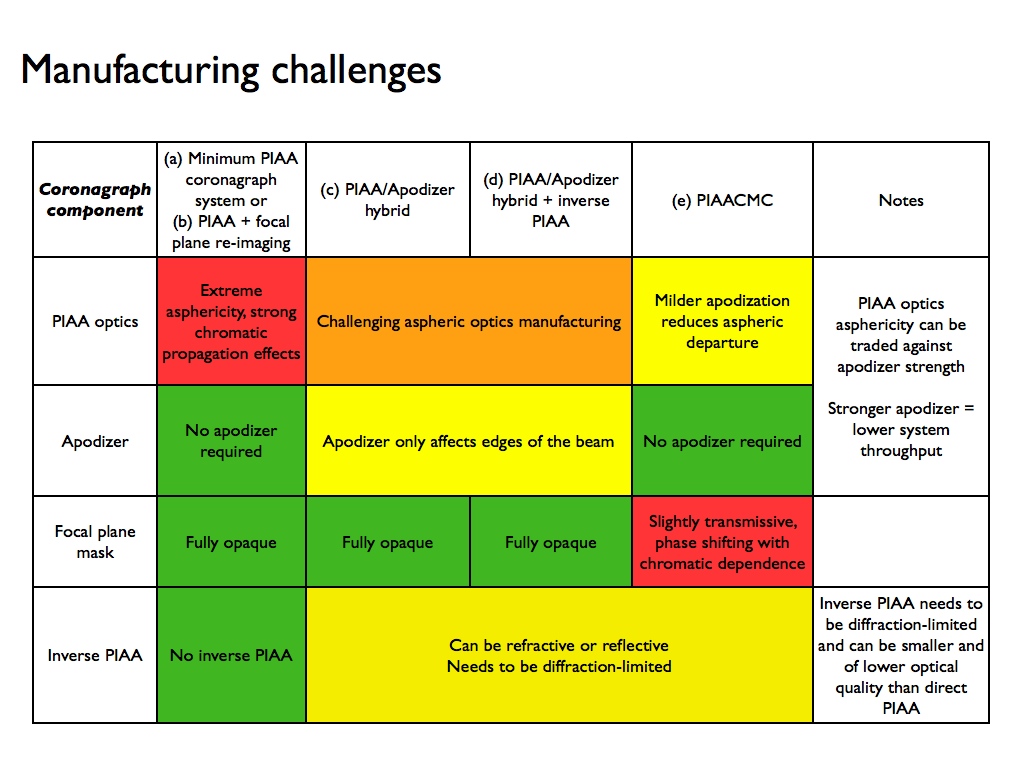 |
Figure 4: For each of the four architectures, manufacturing challenges are different, as shown in this table. |
| δφ(r,θ)/δr = α A(r) cos(θ-θ0). | (equ 1) |
|---|
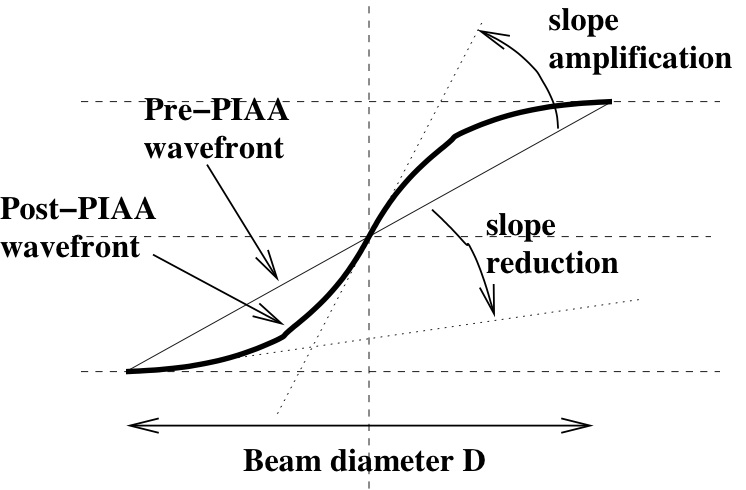 |
Figure 5: Slope amplification and reduction factors in a PIAA system. The remapping introduced by a PIAA system amplifies the wavefront slope at the center of the apodized beam (where most of the light is located) and reduces the wavefront slope at the edges of the beam. |
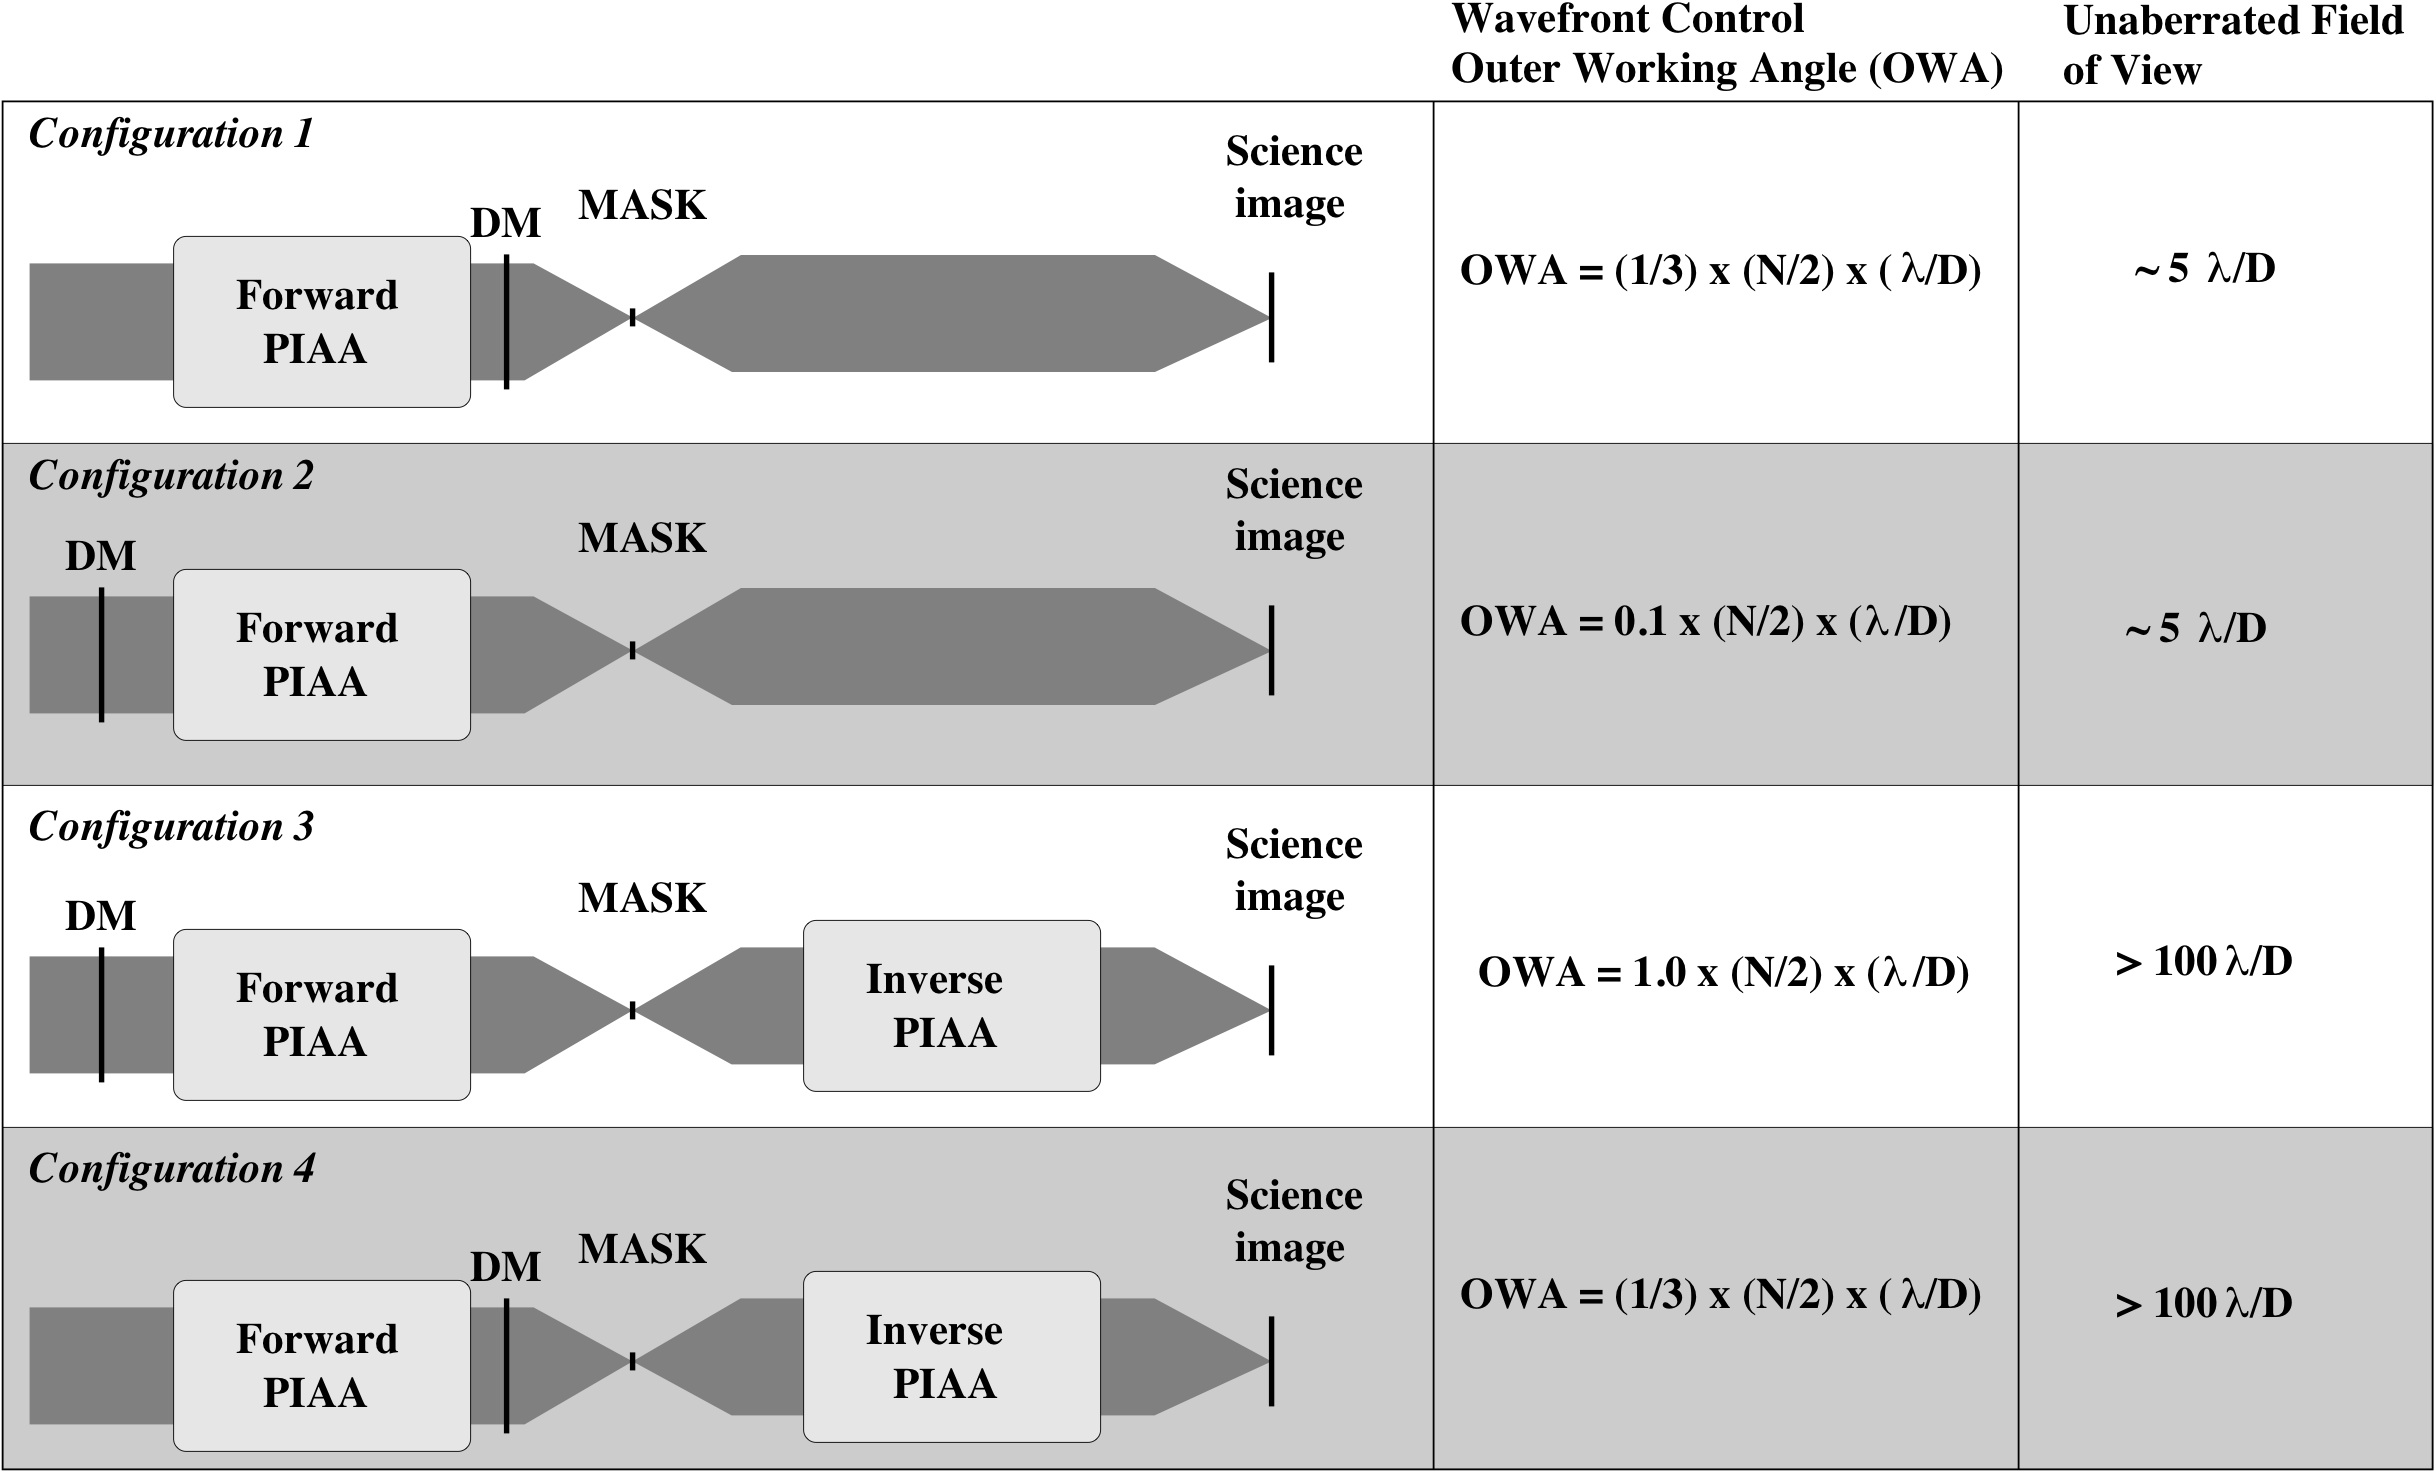 |
| Figure 6: Four possible architectures for a PIAA coronagraph with wavefront control. For each configuration, the outer working angle of the wavefront control system and the field of view imposed by remapping are given. The PIAA slope amplification factor βa = 3 and slope reduction factor βr = 0.3 are considered here. Configurations shown in gray (configurations 2 and 4) should be avoided (see text for details). The unaberrated FOV values are given assuming N=32 actuators across the pupil diameter. |