Information on Engineering-grade Chip for Channel 1
Engineering Detector for Channel 1 during Oct 2007 to Jun 2008
Due to a technical problem in the detector on channel-1, we operated MOIRCS with an Engineering-grade chip during October 2007 to June 2008. The channel-1 data taken during the period should be handled with enough caution for scientific use. We will keep the basic information on the detector here for the possible archive users.
| Gain | 2.95 e-/ADU |
| Read noise | 32 e- rms |
Channel-1 Engineering-grade detector (chip-1) has a prominent large ring-like structure as seen in the dark images. This region has significantly-high dark noise and more possible latents. Scientific use for that ring region may be difficult, or should use with enough calibration data. There are also several smaller and patchy structures, which is sometimes difficult to distinguish with the real scientific features. The example of 600-sec dark frames in fits format are available: CHIP 1 / CHIP 2.
The relative sensitivity of the chip-1 (except ring region) to the detector on channel 2 (chip-2) is estimated to 74.4% in Ks (other bands are not known yet). Gain value and readout noise of chip-1 is similar to chip-2. Linearity for chip-1 (good region only) is also as good as chip-2, but saturation level seems to be less for chip-1.
Appearance of the data
There are no dead pixel islands with the size larger than 1.5 arcseconds on both detector, though several scratches or small holes do exist. There also exists one-pixel-width non-data rows/columns between each quadrant. The unreadable regions are [1:1024,1025:1025], [1025:2048,1024:1024], [1024:1024,1:1024], and [1025:1025,1025:2048]. Examples of raw images can be downloaded from here (CHIP 1 [gif, fits] / CHIP 2 [gif ,fits]).
Linearity
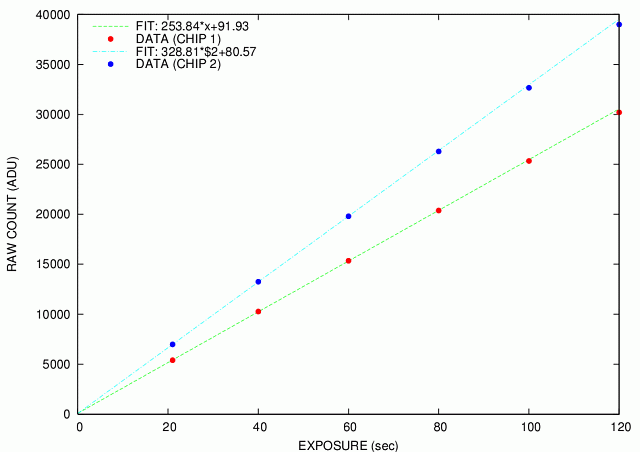
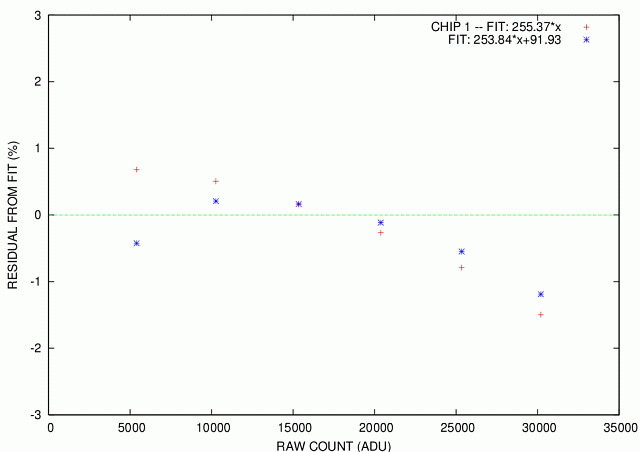
The figures below are the result of the detector linearity measurements executed in Dec 2007. The linearity is maintained within 1% up to 85000 e- and 110000 e- for chip 1 and chip 2, respectively. Note that under the CDS readout the full well will vary depending on the position on the chip and the input flux density (above values were measured near the center of detectors: i.e. deepest well is expected). And also, the measurement for chip 1 was done using region that are relatively clean. For high-dark "ring" region on chip 1 the linearity may be poor.
We recommend to keep the sky count under 20000 ADU for science data, because the detector characteristics starts to change.
|
| Figure 11a. |
|
|
| Figure 11b. | Figure 11c. |
Latent Image
A latent image appears at the level of ~0.06-0.6%. The amplitude seems to depend on the background level (under investigation). In imaging mode the latent seems generally weak ( <0.3% ) and in J it is a bit prominent. In spectroscopy mode or during the narrow-band observation the latent sometimes goes up close to 1% due to the low sky level. Though time is the major factor for eliminating the affection of the latents by saturation, taking several short-exposure dark frames may also work.
Low-level signals by latents may occasionally remain even in your fully-reduced data. A special care must be paid about the reality of faint objects that are close to bright stars. If the magnitude or appearance of the object in question largely changes between final-combined images by average and by median, it can be a spurious. Also, the objects in question around a bright star traces the same pattern as the dither, it may be spurious.
Reset Anomaly (Bias Tilt)
Reset anomaly (Bias tilt) is a specific effect seen in some HgCdTe FPAs such as HAWAII and HAWAII-2. It can be reduced by operating an array continuously and sampling by the CDS (Correlated Double Sampling) method. Though the current chip-2 detector shows only a small level (a few %) of the reset anamaly, the chip-1 detector shows relatively large level of reset anomaly. As getting data with dummy-read option (NDUMMYREAD=2) greatly suppresses it, we usually operates MOIRCS under the mode since November 2007. However, the first image after taking a rest for a while (5~10 minutes) generally shows relatively large anomaly, and may need to abondon that data.
The instrumental minimum exposure times are listed in the table at the top of the page. In the minimum exposure data we see relatively strong reset anomaly. This can be suppressed when we set a bit (+1 to +1.5sec) longer exposure times than the true minimum. So we tend to use the minimum exposure of 13.0 sec for NDUMMYREAD=0 and 20.5 sec for NDUMMYREAD=2 for full readout case.
!!! OBSOLETE !!!
Current Status and the Update
This page is dedicated for sending the information about the characteristics of the Engineering-grade chip mounted on channle 1 on Oct 14 2007, and the subsequently about the replacement to the new scientific-grade detector.2008-06-09 update: About the Replacement Plan
We will be able to change the channel-1 detector to the scientific grade chip on coming July.
There was a difficuly in finding new detector for replacement, because the Hawaii-2 array we use for MOIRCS is basically out of production now. The detector available in the company was almost unique, and that was unfortunately not so ideal as we first hoped. There is a big "hole" of low-sensitivity pixels near the center of a quadrant. The area of "the hole" amounts to ~0.8%, and we will need a big dither size (~40 arcsec) to fill the bad area by the dither for imaging observation. For spectroscopy a more careful design to avoid the hole or another bad regions will be required. The readout noise measured by the company is ~15 e-/sec, a bit worse compared the value for the current channel-2 detector. The Quantum effeciency is also a bit (7.5 %) worse in K, but for J it is better by ~18 %. The homogeneity of the QEs across the detector is much better (rms is ~half) than the channel-2 detector.
Considering the serious scientific loss by keeping operation under the current situation (i.e. the operation by the engineering-grade detector), we have decided to accept the new detector. The engineering work will start in July 1st and it will take at least one month for the completion. The image by new detector will be taken in mid August. The information is to be updated on the website.
2007-12-14 update: Gain and Readout Noise Estimate
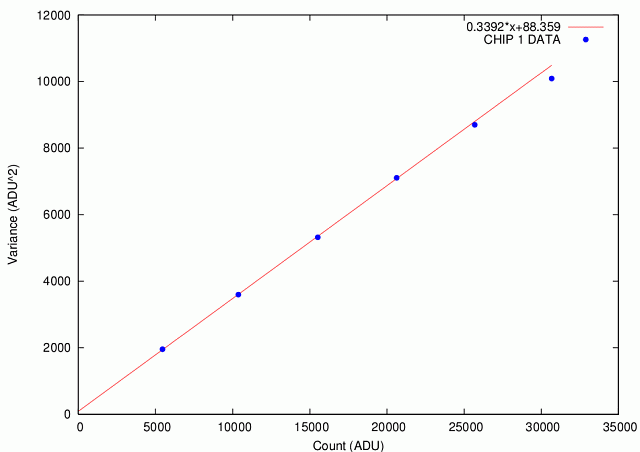
For the estimate of Gain in chip 1, we use the standard photon-transfer curve method. This method assumes that the rms noise of the image is purely from the photon-statistics and the read-out noise. We take a series of K-continuum dome-off images with various exposure times, as shown in the linearity estimate for less-luminous condition (the same dataset is used). In each exposure we took 12 exposures and combined all images but the first 2 frames, under 3-sigma clipping. Sigma images are simultaneously generated by the IRAF imstatistics task. We measure the mid-point from the combined images, as well as their rms noise from the sigma images. The region around [1025:1225,1025:1225] is used for statistics of chip 1 in order to prevent the affect of the "ring" pattern, while for chip 2 statistics [700:1300,700:1300] region is used.
We plot the variation(=sigma^2) with the mid point values. It should be linar relation. Suppose that the average image count is N (ADU) which is actually shown as g (e-/ADU) * F (e-), and the image rms noise is E (ADU) with the readout noise of R (e-). Then there is a relation as follows.
![]()
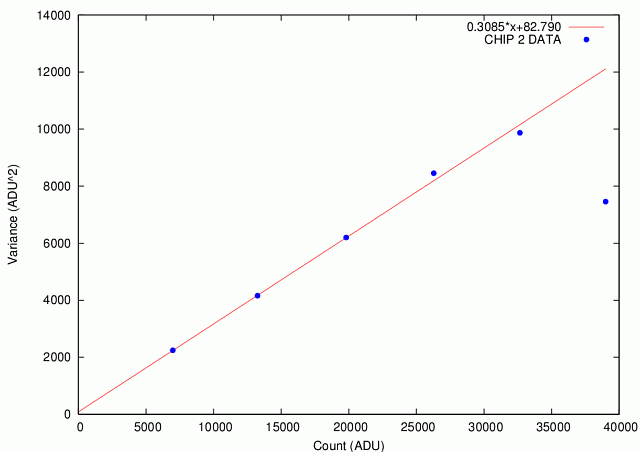
In Figures 8 and 9 we show the result of the fit for chip 1 and 2, respectively.
|
| Figure 8. |
|
| Figure 9. |
The result of the gain and read-out noise estimate is summarized below.
| Gain (e-/ADU) | Readout Noise (e-) | |
|---|---|---|
| CHIP 1 | 2.95 | 27.7 |
| CHIP 2 | 3.24 | 29.5 |
Readout noise for each detector is also independently estimated using the sigma images by 17 21-sec dark images, assuming that the rms noise in each pixel through the 17 set of 21-sec dark is dominated by readout noise. The result is 32.2+-6.2(e-) and 33.4+-7.4(e-) for chip 1 and 2, respectively. The result also well matches to others within errors.
We have shown here that the basic characteristics of chip 1 is not as bad as we first thought. However, we again note that the estimate of linearity, gain, and readout noise for chip 1 described here are all from relatively "clean" region. The data are taken under the controled situation. The characteristics should be much worse around the ring, and any unexpected behavior may appear in real situation. Enough caution should be paid if you try to use the chip-1 data for science.
2007-12-13 update:
1. Linearity of chip 1
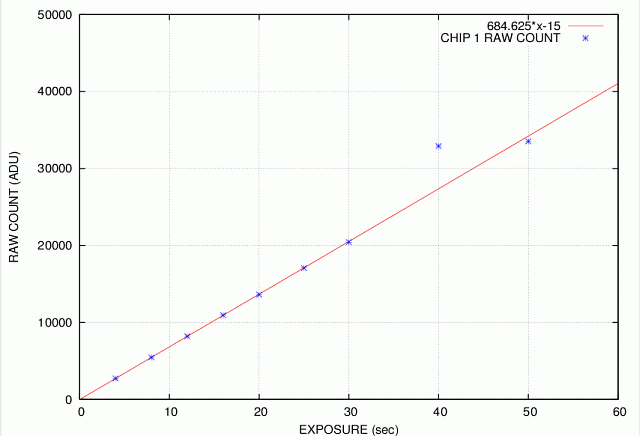
The linarity of the Channel-1 chip is measured by taking a series of dome images using the thermal emission in Ks band during a cloudy night in late November. Temperature of the dome were stable with the difference of < 0.3K level. We used partial-readout mode (512 x 512) for the test because the K-band dome flux was relatively bright. The data was taken from short-exposure to longest until saturation with NDUMMYREAD=2. In each exposure we took three contiguous shots and used the last exposure data for statistics. Darks with the same setting (exposure and partial read setting) were subtracted from the image. The median value of the central 512x512(pixel^2) region were used for statistics using the IRAF task imstatistics with nclip=3 option. Figure 4b shows the degree of residual from the linear fit. Linearity is very good, with much less than 1% until 20000ADU level.
|
| Figure 4a. |
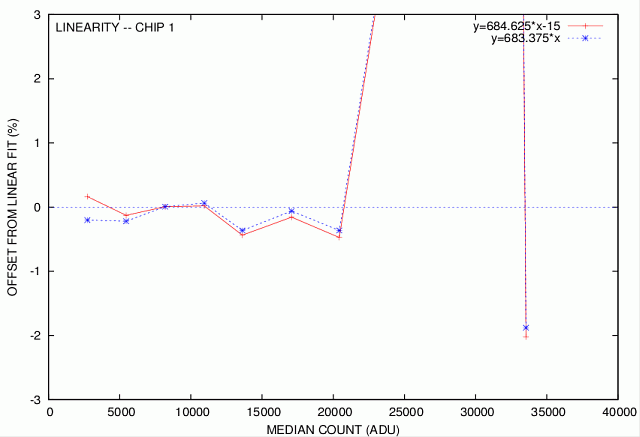
|
| Figure 4b. |
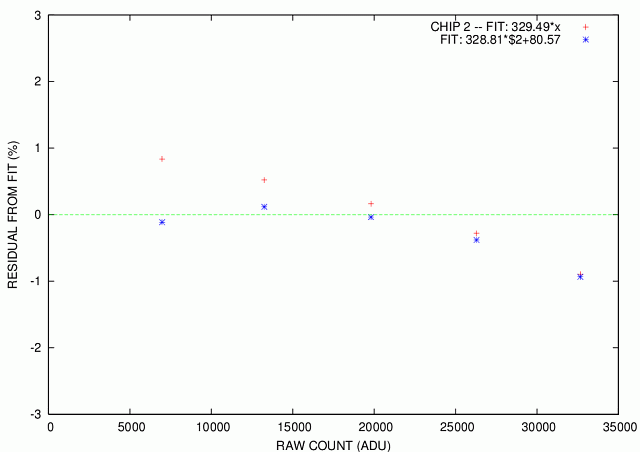
For reference, the result of the linearity measurement in channel-2 chip is also shown in Figure 5. Only the residual from the best fit is plotted. Again, the linearity level is much better than 1 % level till 20000ADU level. Linearity persists 1% level until 35000ADU.
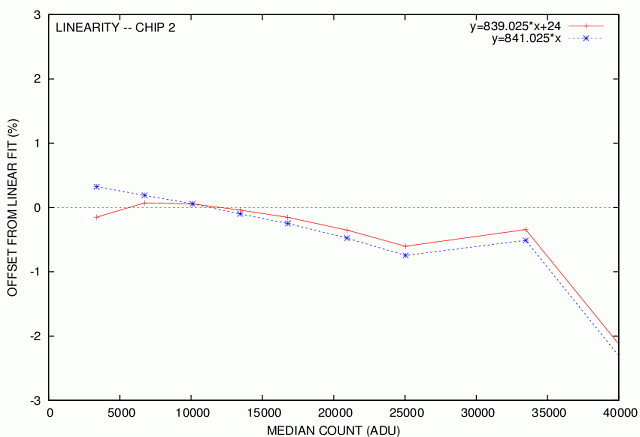
|
| Figure 5. |
We also measured the linearity under less luminous dome condition. For this aim, we used the K-continuum narrowband filter. Again, the thermal emission from the wall of dome during cloudy night on early December was used for the light source. Temperature of the dome was 5.0 degree and very stable during the experiment. As the count rate is low, we used the whole read. We took several exposure with NDUMMYREAD=2. Each exposure we took three contiguous data, and only the last image is used. Darks under the same exposure are subtracted.
The linearity becomes a bit poor for both channel. Under the usual assumption with y-intercept of 0, the deviation from the best fit line is ~1% level for both channel. The results of chip-1 and chip-2 were each shown in Figure 6 and 7, respectively.
|
|
| Figure 6. |
|
|
| Figure 7a. |
|
|
| Figure 7b. |
2. Partial Read Mode
The table below is the result of how dark level changes with the size of partial-read (PRD_SIZE). The same dark data we as we used for linearity measurement is used for image statistics. For image statistics the area [1025:1225,1025:1225] is used.
| PRD_SIZE | MIDPT (CHIP1) | STDDEV (CHIP1) | MIDPT (CHIP2) | STDDEV (CHIP2) |
|---|---|---|---|---|
| 512 | 164.7 | 8.54 | 1.092 | 5.751 |
| 1024 | 94.84 | 7.329 | 1.009 | 5.76 |
| 2048 | 23.59 | 5.839 | 1.754 | 5.726 |
We then check how the counts of the K-band lamp-off dome image changes with the PRD_SIZE. The data was taken during the same night as we took linearity data. Exposure time is fixed to 21 seconds with three different (512x512, 1024x1024, 2048x2048) read-out size. Three images were taken for each setting and the last image in each setting were used for statistics. Darks with the same setting were subtracted. For statistics we use the IRAF imstatistics with nclip=3.
| PRD_SIZE | MIDPT (CHIP1) | MIDPT (CHIP2) |
|---|---|---|
| 2048 (1st) | 14501.41 | 17715.98 |
| 1024 | 14854.86 | 18209.54 |
| 512 | 14959.48 | 18353.05 |
| 2048 (2nd) | 14568.63 | 17813.49 |
There is a systematic discrepancy in mid-point counts between the whole read and the partial read. Though each count shoud be close with each other, partial-readout data always show a higher count by ~424 (chip1) and ~588 ADU (chip2), about 3% level. As the darks are already subtracted, the change of dark level cannot be the cause. Also, the change of the counts in whole-read (2048) mode shows only small rise, the change of the dome temperature cannot explain the result. The cause of this ~3% discrepancy is not yet known.
2007-12-12 update: Characteristics of Dark in chip 1
The dark level on chip 1 varies time to time. The figure below is the sequence of how the median value of the darks changes during several set of contiguous data acquisition. The data were taken with 21-second exposure under NDUMMYREAD=2 option during the observations in late Nov-early Dec. Statistics are measured using the [1025:1225,1025:1225] area avoiding the "ring" region, with the IRAF task imstatistics with the iterative 3-sigma rejection (niter=3). The same data for chip 2 is also shown for reference. In the figure, points connected by lines are the data taken contiguously. These series of data were taken at the start of observation (1st, 2nd, 4th sequences) or flushing after taking high-count data (others: 5th and 7th sequences are after saturation). All sequences show high dark level for 1st data, without regard to the situation. For data after saturation, the count values after second data continuously drops, implying the affection of latent.
|
| Figure 3a. |
Next figure shows the same statistics but on the "ring" pattern in Figure 2 (the region [1800:2000,1724:1924]). For comparison, the chip 1 data shown in Figure 3a is also overplotted. Clearly the characteristics of the ring region is different from other clean region. The affection of the reset anomaly as well as the latent seems large for the ring region.
If we ignore the first image in each sequence, the variation of darks are always less than <30ADU for clean region, but may sometimes as large as ~150 ADU for the ring region.
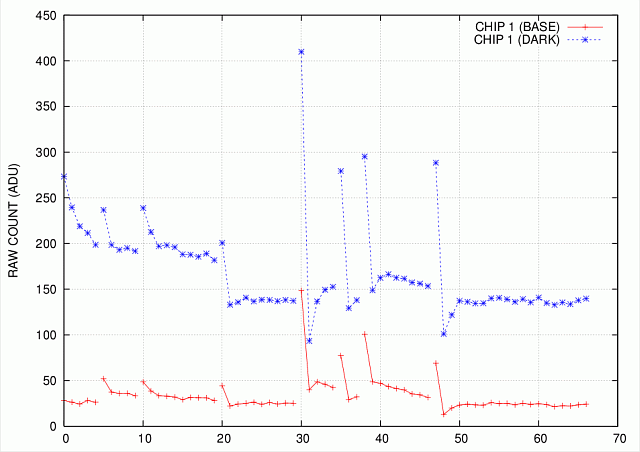
|
| Figure 3b. |
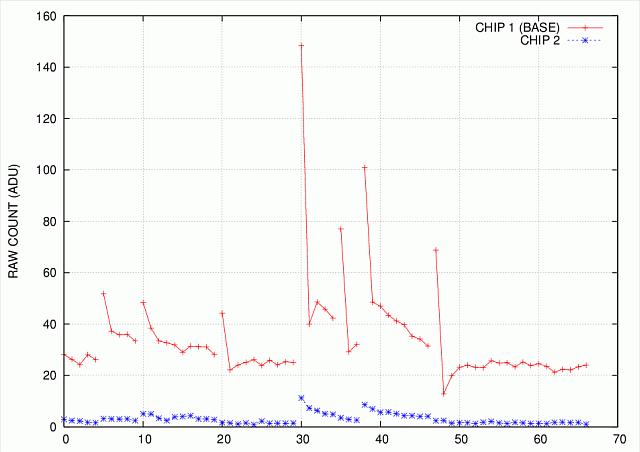
Figure 4 shows the behavior of the dark noise with the median counts. The same data in Figure 3a and 3b are used. Dark noise at the clean region is almost the same as the noise in chip 2. But at the ring region the noise level is 8-9 times larger.
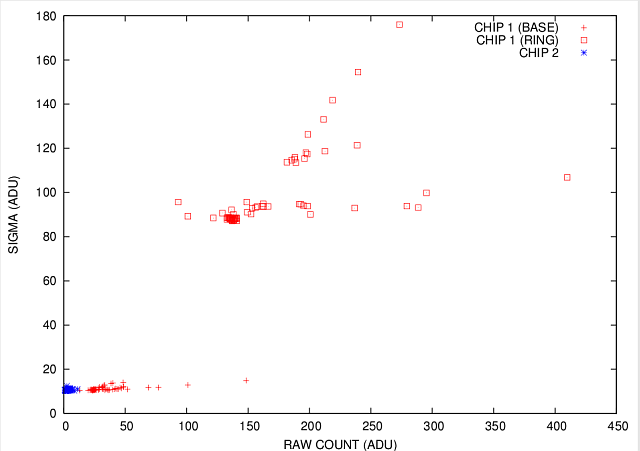
|
| Figure 3c. |
2007-11-07 update:
There is a very large "reset anomaly" on Engineering-grade chip. Each quadrant showed a prominent gradient along slow-read direction. When we took 5 dark frames contiguously with normal mode (NDUMMYREAD=0), first three images showed negative count (~-800ADU) with strong negative gradient up to -2000ADU level. However, with the use of a special readout option (NDUMMYREAD=2 mode) the situation improved greatly. This mode with additional dummyread, however, requires more overhead. The minimum exposure time for whole read will beas long as 20.5 seconds.
The image below is an example of 600-sec dark frame (14 frames are median-combined). The data were taken with NDUMMYREAD=2 option under 8-times multi-sampling. The image is displayed with the range between 0 to 512 ADU, with 5 by 5 boxcar smoothing. A prominent high-dark region (called the "ring") is seen (fits format available: CHIP 1 / CHIP 2 for reference). - updated Dec 13, 2007
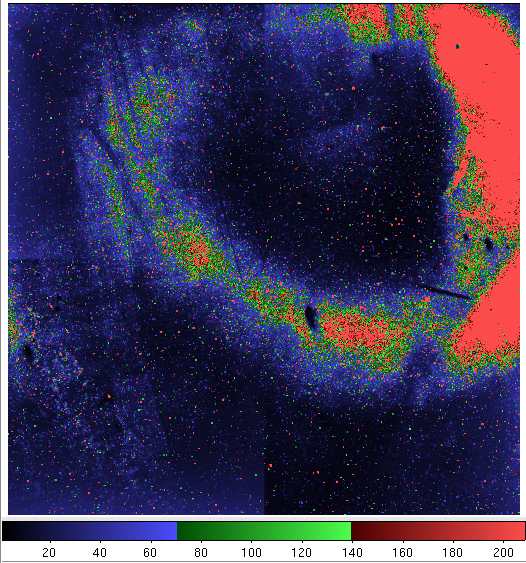 |
| Figure 2. |
A cross section view along the rows 1800-1900pixel(upper) and 800-900(lower) are shown below. Except the bad doughnut-like region, the background count level is around 75ADU. For reference, the background level on chip-2 side is ~22 ADU.
|
| Figure 1a. |
|
| Figure 1b. |
2007-10-19 update:
MOIRCS was transferred to summit from Hilo base and already started vacuuming. No problem was found on the test exposures after transfer. Next week we will start the pre-cooling of the main dewer, which will take nearly whole the week. The first detector test will start on the late weekend. The thorough characterization of the detector may require several weeks.
2007-10-14 update:
Inspection of the channel-1 chipbox has finished and we decided to replace the detector to the existing engineering-grade one. No problem has been found during a preliminary test after installation.
Please contact to the SS if you have any questions.
by Ichi Tanaka