Guide to MOIRCS Imaging Exposure Times
!! Much of the information below are for the previous detectors (for data before June 2015) !!
Background-Limited Operation
In order to achieve the maximum sensitivity for a given integration time, individual exposures should be long enough for the photon shot noise from the sky background to dominate the array read noise. In practice, background-limited performance (BLIP) may be achieved when the sky background noise exceeds the read noise (40 e- is applied here, considering additional noise by the persistence of the sky) by a factor of 3.
| Filter | Background(1) | Min. BLIP time (s)(2) |
Maximum Exposure(3) |
|
|---|---|---|---|---|
| (mag/arcsec2) | e-/s/pixel | |||
| Y | 17.2 | 60 | 240 | 2300 |
| J | 15.6 | 333 | 43 | 400 |
| H | 14.0 | 1665 | 9 | 60 |
| Ks | 13.8 | 1132 | 13 | 100 |
-
Note:
(1) The amplitude of the changes in the sky background level in near infrared is quite large. The change of the sky level by factor of 2-5 times (per night!) has ever been recorded. Values shown here are the approximate median during the 2009 - 2010 imaging observations.
(2) Note that the instrument minimum exposure is 19.7 s (NDUMMYREAD=2 case: for NDUMMYREAD=0 it is 11.5 s) for the full-frame read mode.
(3) Note that the values here is based on the pure saturation, and so one must not consider them as the time which the detectors can keep good linearity. We recommend to keep the sky level within 20000 ADU for science data. The typical exposure times used are, 240-300 s for Y, 70-180 s for J, 21-40 s for H, 30-70 s for Ks.
Saturation Magnitudes
The following table lists the point source "saturation" magnitudes in good seeing condition (~0.4'', when about 3% of the total flux from an unresolved source falls in the peak pixel) with different exposure times. Here we use the word "saturation" as the level that the peak count of the pixels of interest exceeds ~1% linearity range, i.e. ~25000 ADU. To achieve short exposure time, partial readout mode is avaliable but with limited accuracy (below).
| Filter | Saturation magnitude | ||||
|---|---|---|---|---|---|
| 1 s | 13 s | 21 s | 40 s | 120 s | |
| Y | 10.2 | 13.0 | 13.5 | 14.2 | 15.5 |
| J | 10.4 | 13.3 | 13.8 | 14.6 | 16.3 |
| H | 10.6 | 13.7 | 14.5 | 16.3 | - |
| Ks | 10.0 | 13.0 | 13.6 | 14.8 | - |
Partial Readout Mode
Bacause of a large format of HAWAII-2, it takes 11.5 seconds to read out all the pixels of each quadrant. On the other hand, a standard star observation requires a shorter exposure to prevent saturation. Therefore, short exposures should be realized by using a partial readout mode. The following table indicates the sizes of partial readout area and the corresponding minimum exposure times. We recommend to use about 1-1.5sec longer exposures than the listed here for scientific data to suppress the reset anomaly.
Note that the output fits file has the size 2048 x 2048 without regard to the size of readout.
| PRD_SIZE (pixel) | Minimum exposure time (s) | |
|---|---|---|
| NDUMMYREAD=0 | NDUMMYREAD=2 | |
| 2048 x 2048 | 11.47 | 19.69 |
| 1536 x 1536 | 6.84 | 11.84 |
| 1024 x 1024 | 3.38 | 5.95 |
| 512 x 512 | 1.11 | 2.01 |
Note 1: The HAWAII-2 has four independent quadrants, and the 1-pixel-width rows/columns on each quadrant boundaries are not readable. A care should be paid for not entering into the unreadable rows/columns when taking standard stars. (Please refer to Figure 3).
Note 2 (!! Important !!): A systematic bias in the photometry is to be introduced when the partial-read mode is used for photometric calibration. The level of systematics is the strong function of the partial-read size as well as the input flux level. In the worst case, the sytematics introduced by it can be as large as 10% level. The use is not recommended now. See the Information Page for more detail.

Figure 3: An example of standard star observation with the partial read mode (1024 x 1024). Partial-read mode will be applied to both channel simultaneously, and regions around the center of each detector will be read out (the image center does not change). Please note that the distance between the center of each detector has 3.0 arcminutes projected on the sky (Please refer to Figure 1). A standard star (a star symbol) should be imaged within one quadrant, since the boundaries of the four quadrants are not readable. (Cross lines on the figure above indicates the boundaries of each quadrant).
Dither Pattern
During the science data acquisition, a set of the imaging data is acquired with shifting the pointing position between each exposures ("dithering"). This is for making the "median sky", the median-averaged sky image without objects. The pattern of the dither for MOIRCS imaging observation is a circule as shown below. Dither length (diameter of the circle) should be larger than the size of the largest object in the field, and the number of image by the dithered obs should be at least 5 for better median sky.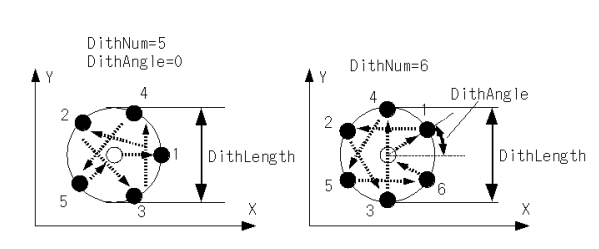
Overhead
!! This is for the previous detectors (for data before June 2015) !!
The overhead includes readout time (11.5 sec), data transfer time from DSP memory to PCs (~15 sec), and the time related to the move of telescope (~15sec). Under the use of dummy read option (NDUMMYREAD=2) the additional 8.5 seconds is needed for readout.
The length of the exposure time and the number of coadds at each point of a dither pattern should be changed depending on the background level and the variability of the sky. As we do not use the autoguider during the imaging observation, taking a data in a position using too many co-adds may cause the degration of the stellar shape. The recommended time you can stay in each position in a dither is within 3 minutes.
The overheads under a typical 9-point + center dither observation with the default NDUMMYREAD=2 cases are shown in the table below. Values with specific condition can be calculated using the Overhead Calculator prepared by us [Microsoft Excel Format].
| Filter | Overhead | Typical exposure time (s) |
|---|---|---|
| Y | 16 % | 300 s (coadds=1) |
| J | 38 % | 130 s (coadds=1) |
| H | 79 % | 35 s (coadds=4) |
| Ks | 60 % | 50 s (coadds=3) |
Note 1:
[Overhead] = ([Total Observing Time] - [Total Integration Time]) / [Total Integration Time]
Note 2:
Please note that the Subaru Imaging ETC DOES NOT calculate the entire overhead time since it depends on the number of coadds at a each point of a dither pattern. Please use our Overhead Calculator for more exact values.
!! Note that the calculator is updated for S16A applicants !!
Please note that all data on these pages are subject to change as the evaluation of the performance of MOIRCS progresses.
Updated 2015-08-05