Direction on Arrays
Last Up Date 2001.8.29
Direction on the Imaging Array
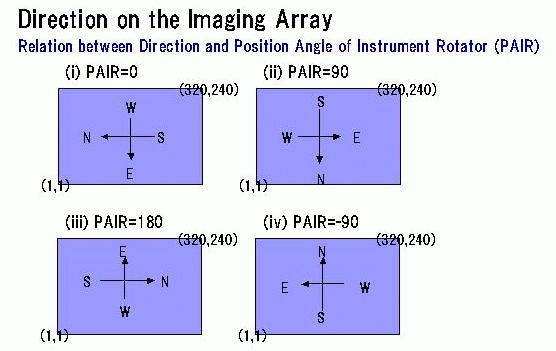
NS axis is not exactly aligned to row axis, but tilted against
row axis by -0.45 degree when PAIR=0 (that is, north comes a little
upper than south). For different PAIR, corresponding tilt angle.
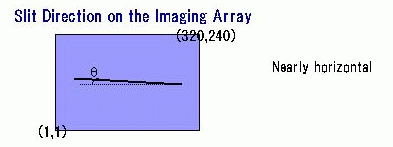
Slit is tilted against row axis a little.
Its angle is diffrent for each slit.
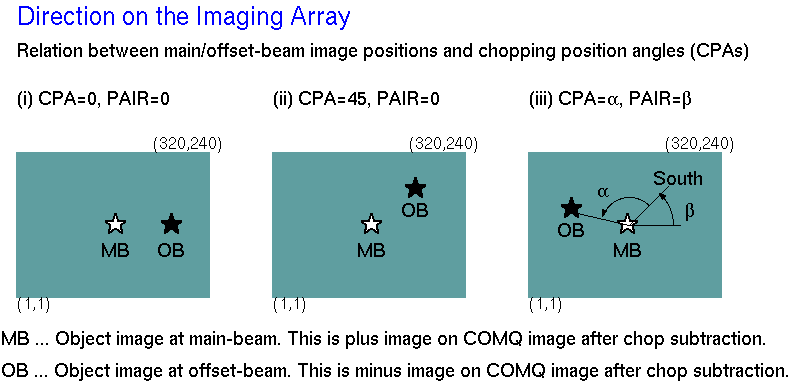
COMQ images are automatically generated from raw main-beam/offset-beam
images (COMA images, that is including sky emission, dark current,
and object signal) by chopping subtraction.
Spectra Image Configuration on the Spectroscopic Arrays
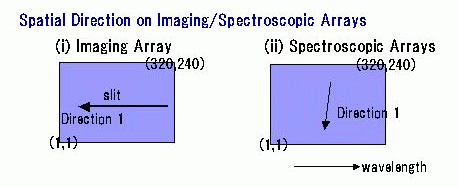
Spatial axis is tilted against column axis.
The tilted angle is larger for high-resolution mode and for long wavelengths.
The values are
about 0.9 degree for low-resolution spectroscopy in the N-band,
about 4 degree for mid-resolution spectroscopy in the N-band,
about 6 degree for Q-band spectroscopy.
How to determine grating positions
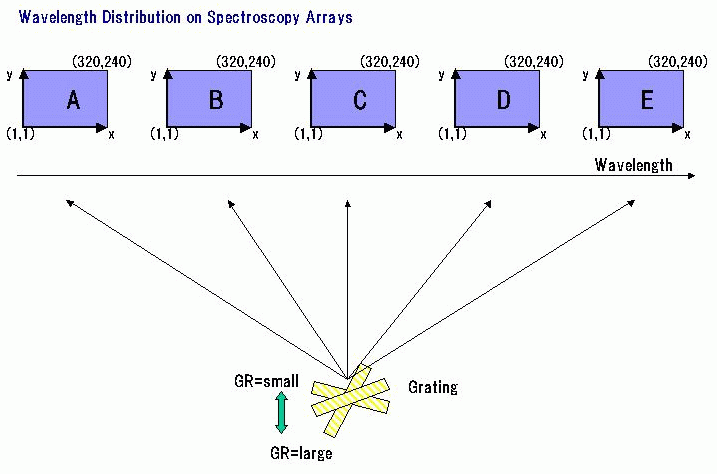
General
- On each detector, wavelength increase as row number, that is x
coordinate.
- The smaller the grating position in pulse number is, the shorter
the observed wavelength is.
N-band low-resolution spectroscopy
- Use the central detector for N-band low-resolution spectroscopy
because the configuration is the most efficient.
- Grating position for the mode is 4888 under the Ge window and
is 4800 under the KBr window.
N-band mid-resolution spectroscopy
- Relation between grating position in pulse (GR), column x of a pixel
on each detector, and wavelength l [micron] at the pixel is given roughly by
following equations (results from NH3 gas cell observations).
- C: l = ( -1.994e-08 * GR + 1.992e-03 ) * x + ( 1.435e-03 * GR + 4.742 )
- B: l = ( -1.990e-08 * GR + 2.019e-03 ) * x + ( 1.442e-03 * GR + 3.627 )
Q-band mid-resolution spectroscopoy
- Not measured by sky lines or NH3 gas cell.
- Rough relation between GR, x, and l are written by following
equations (measurement using filter edges).
- C: l = 0.00215 * x + (0.0017375 * GR + 13.4225)
- B: l = 0.00215 * x + (0.0017375 * GR + 12.1975)


