Last Up Date 2002.1.10
Overview
Observers visiting Subaru Telescope use a work-station 'ana' for quick
reduction. Some useful original tools to reduce and display COMICS data
are prepared in 'ana'. Principally, login with your account given by
administrator of subaru network system and ask how to use those tools
to your support scientist.
The main tools installed for COMICS are as follows:
1. XFC: a viewer for COMICS data.
2. 'q_' series program to reduce COMICS data.
We explain what they are and how to use them below.
In 'ana', many standard tools to reduce data, such as IRAF, saoimage, IDL, and
so on. You can of course use them to reduce COMICS data.
However, note that some IRAF tasks cannot deal with 4-dimension image and
COMICS data have four dimensions.
Viewer XFC/XFV
XFC is a viewer developed for displaying COMICS data.
Though it was originally developed by K. Nakamura (NAOJ), but current version
is developed using 'gtk' by H.Kataza (ISAS).
Since COMICS has one detector in the imaging section and
five detectors in the spectroscopic section, XFC are developed so that
all of the six detector images can be shown.
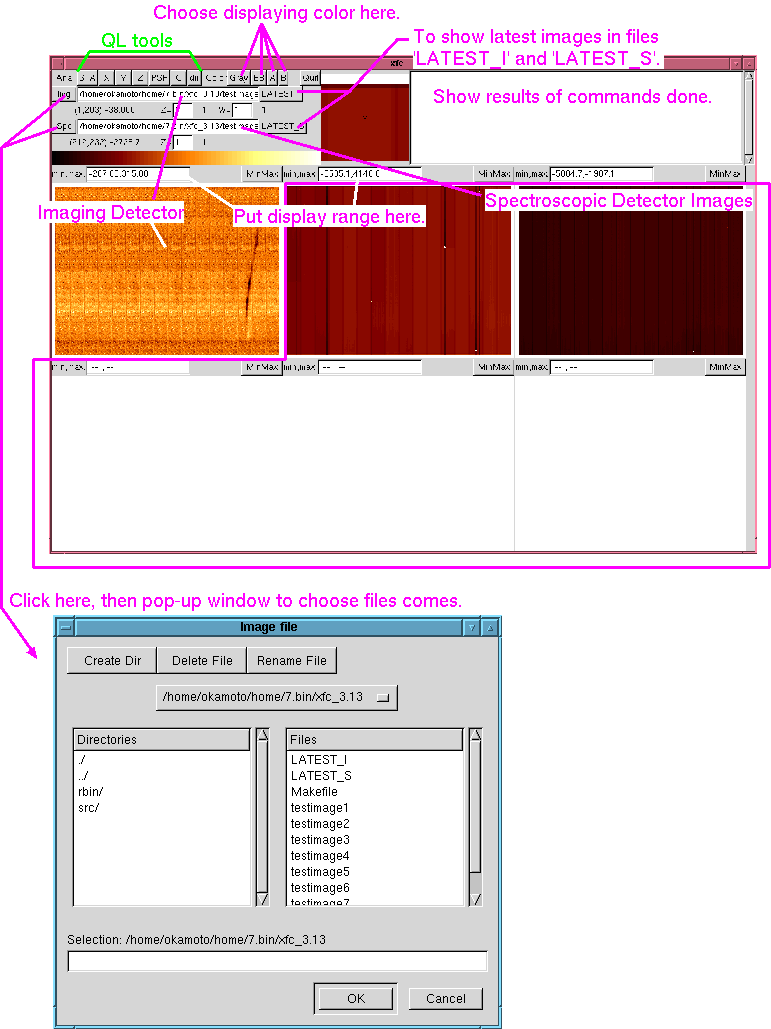
Current aspect of 'xfc' is shown below in Figure 1.
Figure 1. Aspect of 'xfc'.

In xfc, specify file names at the two small boxes at the upper left.
'Img' means the file name for imaging data, and 'Spc' means the
file name for spectroscopic data. The file specified in the 'Img' white box
is shown at the upper-left image. The rest five image section shows the
file specified in the 'Spc' white box.
You can also choose files from pop-up windows shown by
clicking 'Img'/'Spc' button.
The newest imaging and spectroscopic data will be written to
files 'LATEST_I' and 'LATEST_S', respectively. If you click the
'LATEST_I' or 'LATEST_S' button, the newest data are displayed.
From 'ana', run the following shell script from a window:
% xfcdw
On xfc, some buttons to reduce the displayed data are prepared.
They are,
Figure 2. Reduction tools on xfc.

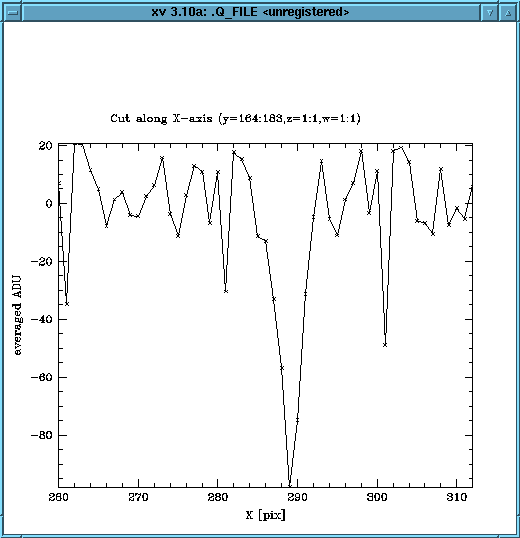
Figure 3. The result of x-cut.

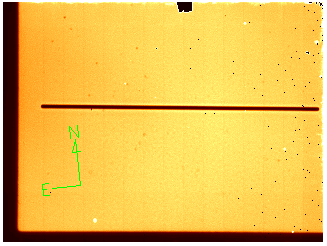
Figure 4. Click 'dir' buttom to show direction on the images.

You can get the newest source of 'xfc' from
http://canadia.ir.isas.ac.jp/comics/private/soft_xfc/index.html .
If you found any bugs related to xfc and/or you have some ideas to
improve xfc, please contact members of COMICS developping team.
"q" Series reduction program for COMICS data
The "q" series reduction programs are prepared for reduction of
COMICS data. They are written in programming language 'C' and
you can usually use them on your own computers.
You can get the newest source of 'q_' series program from
http://canadia.ir.isas.ac.jp/comics/private/soft_rbin/ .
All of the program names start with 'q_'.
The programs are as follows:
| q_2val | Transform images into two-value images using a specified threshold value. |
| q_arith | Do addition, subtraction, multiplication, and division between images or between images and values. |
| q_badpix | Pick up bad pixels. |
| q_bsep | Distribute frames in the specified data into separate files by beams. |
| q_chgaxis | Change NAXIS value into 2, 3, or 4. |
| q_chopcmb | Do chop subtraction. |
| q_ecosum | Make real ECO mode image from COMA data. |
| q_fcombine | Take average, median, and stddev images from the input images. |
| q_head | Pick up the specified FITS header values. |
| q_headlst | Make tables of major useful FITS headers of the specified images. |
| q_list_stat | Do statistics, x-, y-, z-, w-cut in the specified region. |
| q_mkimg | Make images from data files of plain text. |
| q_noise | Measure the average and standard deviation values within the specified area. |
| q_photo | Make PSF fit to a selected region of the image. |
| q_plot_stat | Show the x-, y-, z-, w-cut in the specified region. |
| q_sky_nlow | Do wavelength calibration against data taken in the low-resolution spectroscopy in the N-band. |
| q_startrace | Trace a star position by fitting gaussians at each x. |
| q_subdark | Subtract dark current from the specfied data. |
| q_telmove | Calculate how much you should move the telscope. |
| q_transtable | Make table to transform the data taken in the low-resolution specttaken in the low-resolution spectroscopy in the N-band so that the wavelength and space axes align along the row and column, respectively. |
| q_transtable2 | Make table to transform the data taken in the low-resolution specttaken in the low-resolution spectroscopy in the N-band so that the wavelength and space axes align along the row and column, respectively. |
| q_unittime | Divide COMQ files by the on-source integration time calculated from the FITS header values. |
| q_wcombine | Statistics of files with specified weight. |