MOIRCS Channel-1 Detector Information Page
Current Status and the Update
This page is dedicated for sending the information about the characteristics of the new scientific-grade chip mounted on channle 1 on July 17 2008. The old webpage about the Engineering-grade detector used during October 2007 to June 2008 can be found here.2008-11-04 update: New Linarity & Gain Measurements
We re-measured the linearity and also measured the gain of each detector. The measured gain and readnoise values are fairly reasonable compared to the tentative values we got in August.
The data is taken in the same manner as August, i.e. we used the thermal emission from aluminum plate on instrument window as a light source. Measurement was done when MOIRCS was detouched from telescope and stayed in the IR stand-by room. No day-time activity was done as it was holiday. K-continuum filter is used. This time we apply three WIPE to the detectors between each exposure set. The result shows much improvement. We take 8 images with various exposures (25 to 350sec with NDUMMYREAD=2) for various count level. The stability of the thermal emission was carefully checked, and confirmed to be fairly stable during the measurement(~1%). Bias was not subtracted because it was proven to be totally negligible in previous measurement. The graphs below are the result of the linearity measurement.
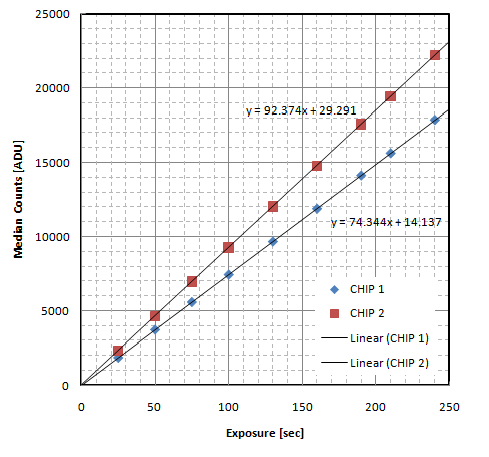
Figure 4a.
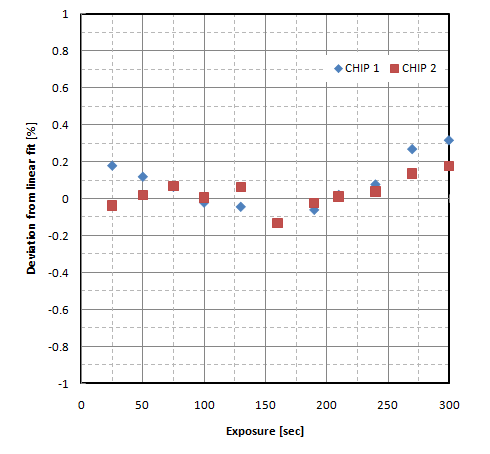
Figure 4b
Figure 4a: The result of the linearity measurement. Horizontal axis is the exposure time and vertical axis is the median counts of each detector in ADU units. Fitting results are also shown. Figure 4b: Deviation of the data from the linear fit. The linearity is now shown as extremely good (-0.2% to +0.4% in range) until ~30000 ADU.
The result of linearity measurement shown above is an order of magnitude better than the estimate we did during August. The difference between these dataset is whether we applied WIPE or not. Although we still does not address the origin of the discrepancy yet, we consider that the new data should be more realistic because the WIPE is applied before each exposure in the usual operation. Another support is the value of the estimated Gain (below), which is similar to the laboratory value we tested before.
Next we show the result of the gain estimate. We again apply the standard photon-transfer curve method. This method assumes that the rms noise of the image is purely from the photon-statistics and the read-out noise. We combined all images except the 1st frame for each exposure data under 3-sigma clipping, then the sigma images are simultaneously generated by the IRAF imscombine task. We measure the mid-point from the combined images, as well as their rms noise from the sigma images. The region [700:1300,700:1300] is used for statistics.
We plot the variation(=sigma^2) with the mid-point values. It should be a linar relation. Suppose that the average image count is N (ADU) which is actually shown as g (e-/ADU) * F (e-), and the image rms noise is E (ADU) with the readout noise of R (e-). Then there is a relation as follows.
![]()
The result is shown in Figures 5.
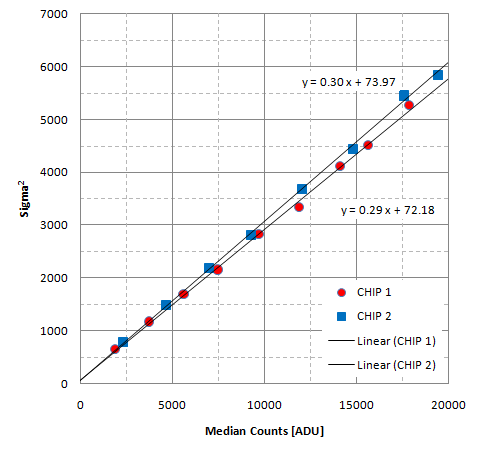
Figure 5.
The result of the gain and read-out noise estimate is summarized below.
| Gain (e-/ADU) | Readout Noise (e-) | (Readout Noise by Dark) | |
|---|---|---|---|
| CHIP 1 | 3.50 | 29.8 | 35.6 |
| CHIP 2 | 3.33 | 28.7 | 33.7 |
The values for chip 2 is larger than the estimate by Ichikawa et al.(2007, SPIE) which showed the gain value of 2.86 e-/ADU. The discrepancy may arise from the difference of the way of estimating the image statistics. In Ichikawa et al. they used the data taken by the partial-read mode as well as the whole read mode. Later we recognized that the use of partial-read mode may introduce a bias to the raw count data (see Information page of MOIRCS website). The new data shown here is based on the whole read, and no such uncertainty is introduced.
Readout noise for each detector is also independently estimated using the sigma images by 10 21-sec dark images, assuming that the rms noise in each pixel is dominated by readout noise. The result is 35.6e- and 33.7e- for chip 1 and 2, respectively. The result is larger than the one estimated by photon transfer method. The direct estimate by dark images may be more realistic value, as the estimate of cross section by photon-transfer method tends to be affected by the small errors in fitting.
2008-08-24 update: Linarity Measurement
The graph below is the result of the linearity measurement. The data is taken using the thermal emission from the mirror cell cover by K-continuum filter during the day time. We took a set of images with various exposures (21 to 336sec with NDUMMYREAD=2) to acquire the data with various count level. The stability of the light source was carefully checked to be good enough during the measurement(<1%). Bias data with various exposures were independently taken and proved to be totally negligible in both detector (~15ADU or 0.05% even in the longest 300-sec exposure), so bias was not subtracted.
In the graph the horizontal axis indicates the median counts around the center of each detector. The vertical axis is the offset from the linear fit (assuming the y-cross section of 0). The fitting is performed using the data less than 30000 ADU (across the red arrow). The data by new chip (Chip 1) shows almost the same behavior as Chip 2, indicating that the new detector has enough good linearity performance for scientific use. Note that the counts below 5000ADU shows relatively large deviation. We suspect that it is caused by the persistence and not true.
The count level of the dome flats in J and H are almost the same (matches within 1 %!), and for Ks it is slightly lower (~7%) than channel 2 chip. Althgough we do not estimate the gain of the new detector yet, we can say that the performance of both channel matches fairly well now.
2008-08-15 update: The image by the new detector We saw a "reset anomaly" pattern at the edge of each quadrant in NDUMMYREAD=0 mode. It disappeared in NDUMMYREAD=2 mode. Therefore the default operation will be on NDUMMYREAD=2 mode during S08B. 2008-07-31 update: New scientific detector is installed! 2008-06-09 update: About the Replacement Plan There was a difficuly in finding new detector for replacement, because the Hawaii-2 array we use for MOIRCS is basically out of production now. The detector available in the company was almost unique, and that was unfortunately not so ideal as we first hoped. There is a big "hole" of low-sensitivity pixels near the center of a quadrant. The area of "the hole" amounts to ~0.8%, and we will need a big dither size (~40 arcsec) to fill the bad area by the dither for imaging observation. For spectroscopy a more careful design to avoid the hole or another bad regions will be required. The readout noise measured by the company is ~15 e-/sec, a bit worse compared the value for the current channel-2 detector. The Quantum effeciency is also a bit (7.5 %) worse in K, but for J it is better by ~18 %. The homogeneity of the QEs across the detector is much better (rms is ~half) than the channel-2 detector. Considering the serious scientific loss by keeping operation under the current situation (i.e. the operation by the engineering-grade detector), we have decided to accept the new detector. The engineering work will start in July 1st and it will take at least one month for the completion. The image by new detector will be taken in mid August. The information is to be updated on the website.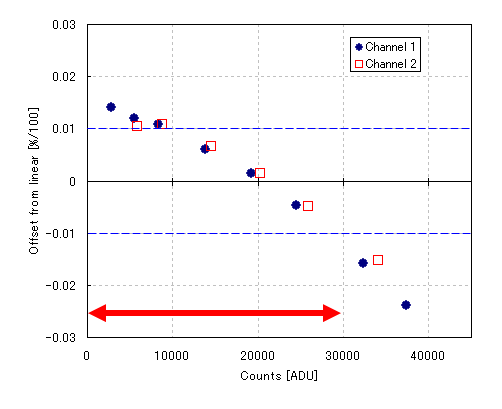
Figure 3: The result of the linearity measurement. Horizontal axis indicates the median counts of each detector in ADU units and vertical axis is the offset from the linear fit (assuming the y-cross section of 0). The red arrow indicates the range used during the usual observation. The affection of the persistence in the image gradually gets large at low-count level (<5000) and apparently shows larger offsets. We can say that the linearity is pretty good (+-1.5% range) until ~30000 ADU.
Dewar cooling has completed yesterday. Shown below is the Ks-band thermal-light image taken by the new detector (raw image). Appearance is the same as Figure 1, except the shadow by the field dividing mirror on the right. The radius of the "hole" pattern is about 100 pixels, with the center at (1595,1630). A 3-pixel-width row of dead pixels is also seen on the 4th quadrant (y = 648 pix). A slight shadow pattern on the left edge is caused by the newly-installed ghost-blocking plate. The width of the shadow is 10-20 pixels. The FITS version of the image can be downloaded from here.
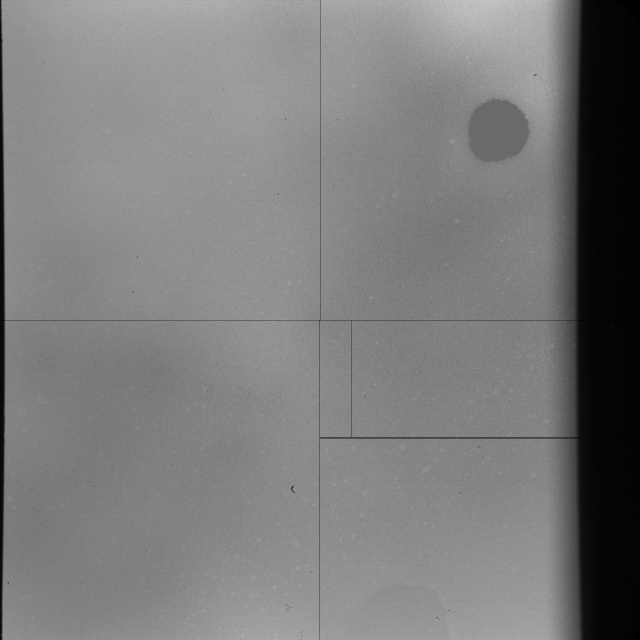
Figure 2: The Ks-band image by the new detector. It is the thermal-light image from the room-temperature panel on the window of MOIRCS. A high-resolution version is also available.
The new detector was successfully installed in July 17, 2008. Currently MOIRCS is still warm and waiting for the cool down that will occur in mid August.
We will be able to change the channel-1 detector to the scientific grade chip on coming July.
Figure 1: The K-band QE map of the new scientific detector that is supplied by Teledyne (rotated to match the MOIRCS raw data rayout). There is a big "hall" near the center of the first quadrant, which is the pattern of saturated counts. The area occupied is roughly 0.8%. Though the region is flagged as "operatable", we do not know the character of the region.
Please contact to the SS if you have any questions.
by Ichi Tanaka